[1] "Pre-AI Cases: 223"[1] "Post-AI Cases: 206"Cluster CASES based on marker data (ER, PR, Ki67, HER2) from all pathologists. The goal is to visualize how cases group together biologically and how consistent these groupings are across pathologists, comparing Pre-AI and Post-AI phases.
Note for Pathologist: This is an experimental visualization. It attempts to group patients based on their similarity. If the AI is working, we expect the groups to become sharper and more distinct (e.g., all “Luminal B” patients clustering tighter together) because everyone is scoring them more similarly.
We will create a matrix where:
- Rows = Cases
- Columns = Marker values for each Pathologist (e.g., ER_Path1, ER_Path2, PR_Path1…)
We will do this separately for Pre-AI and Post-AI.
[1] "Pre-AI Cases: 223"[1] "Post-AI Cases: 206"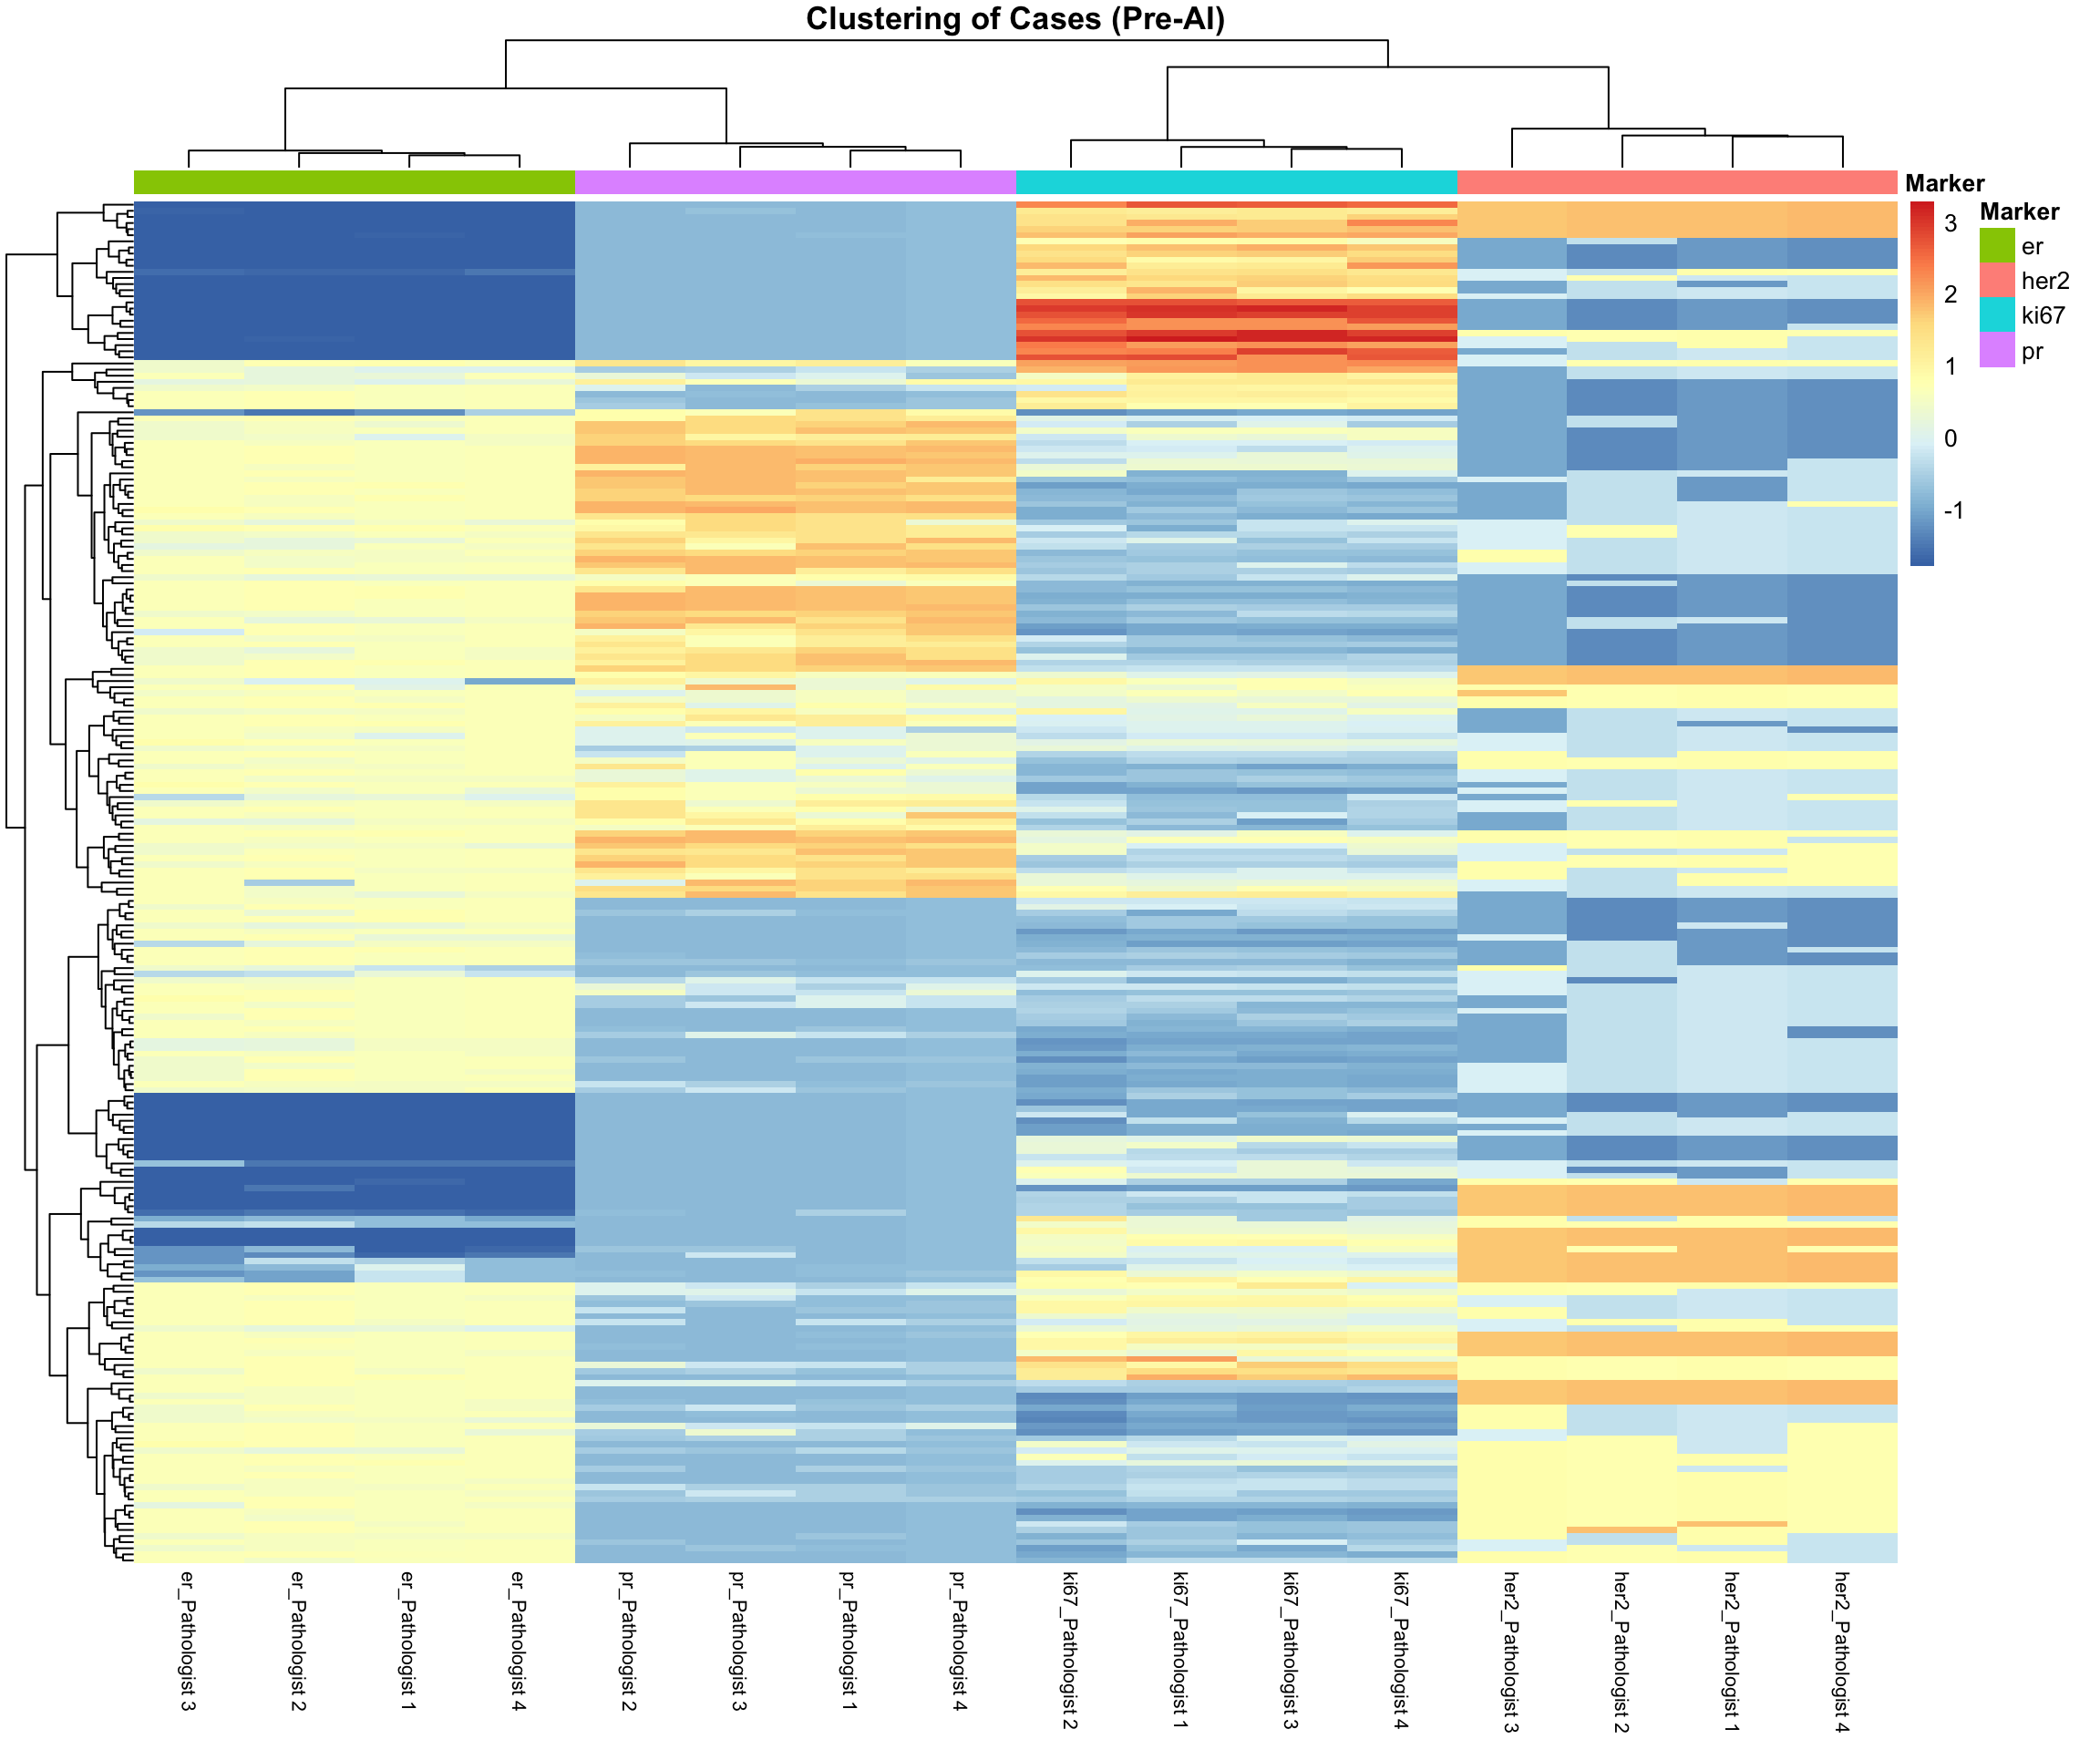
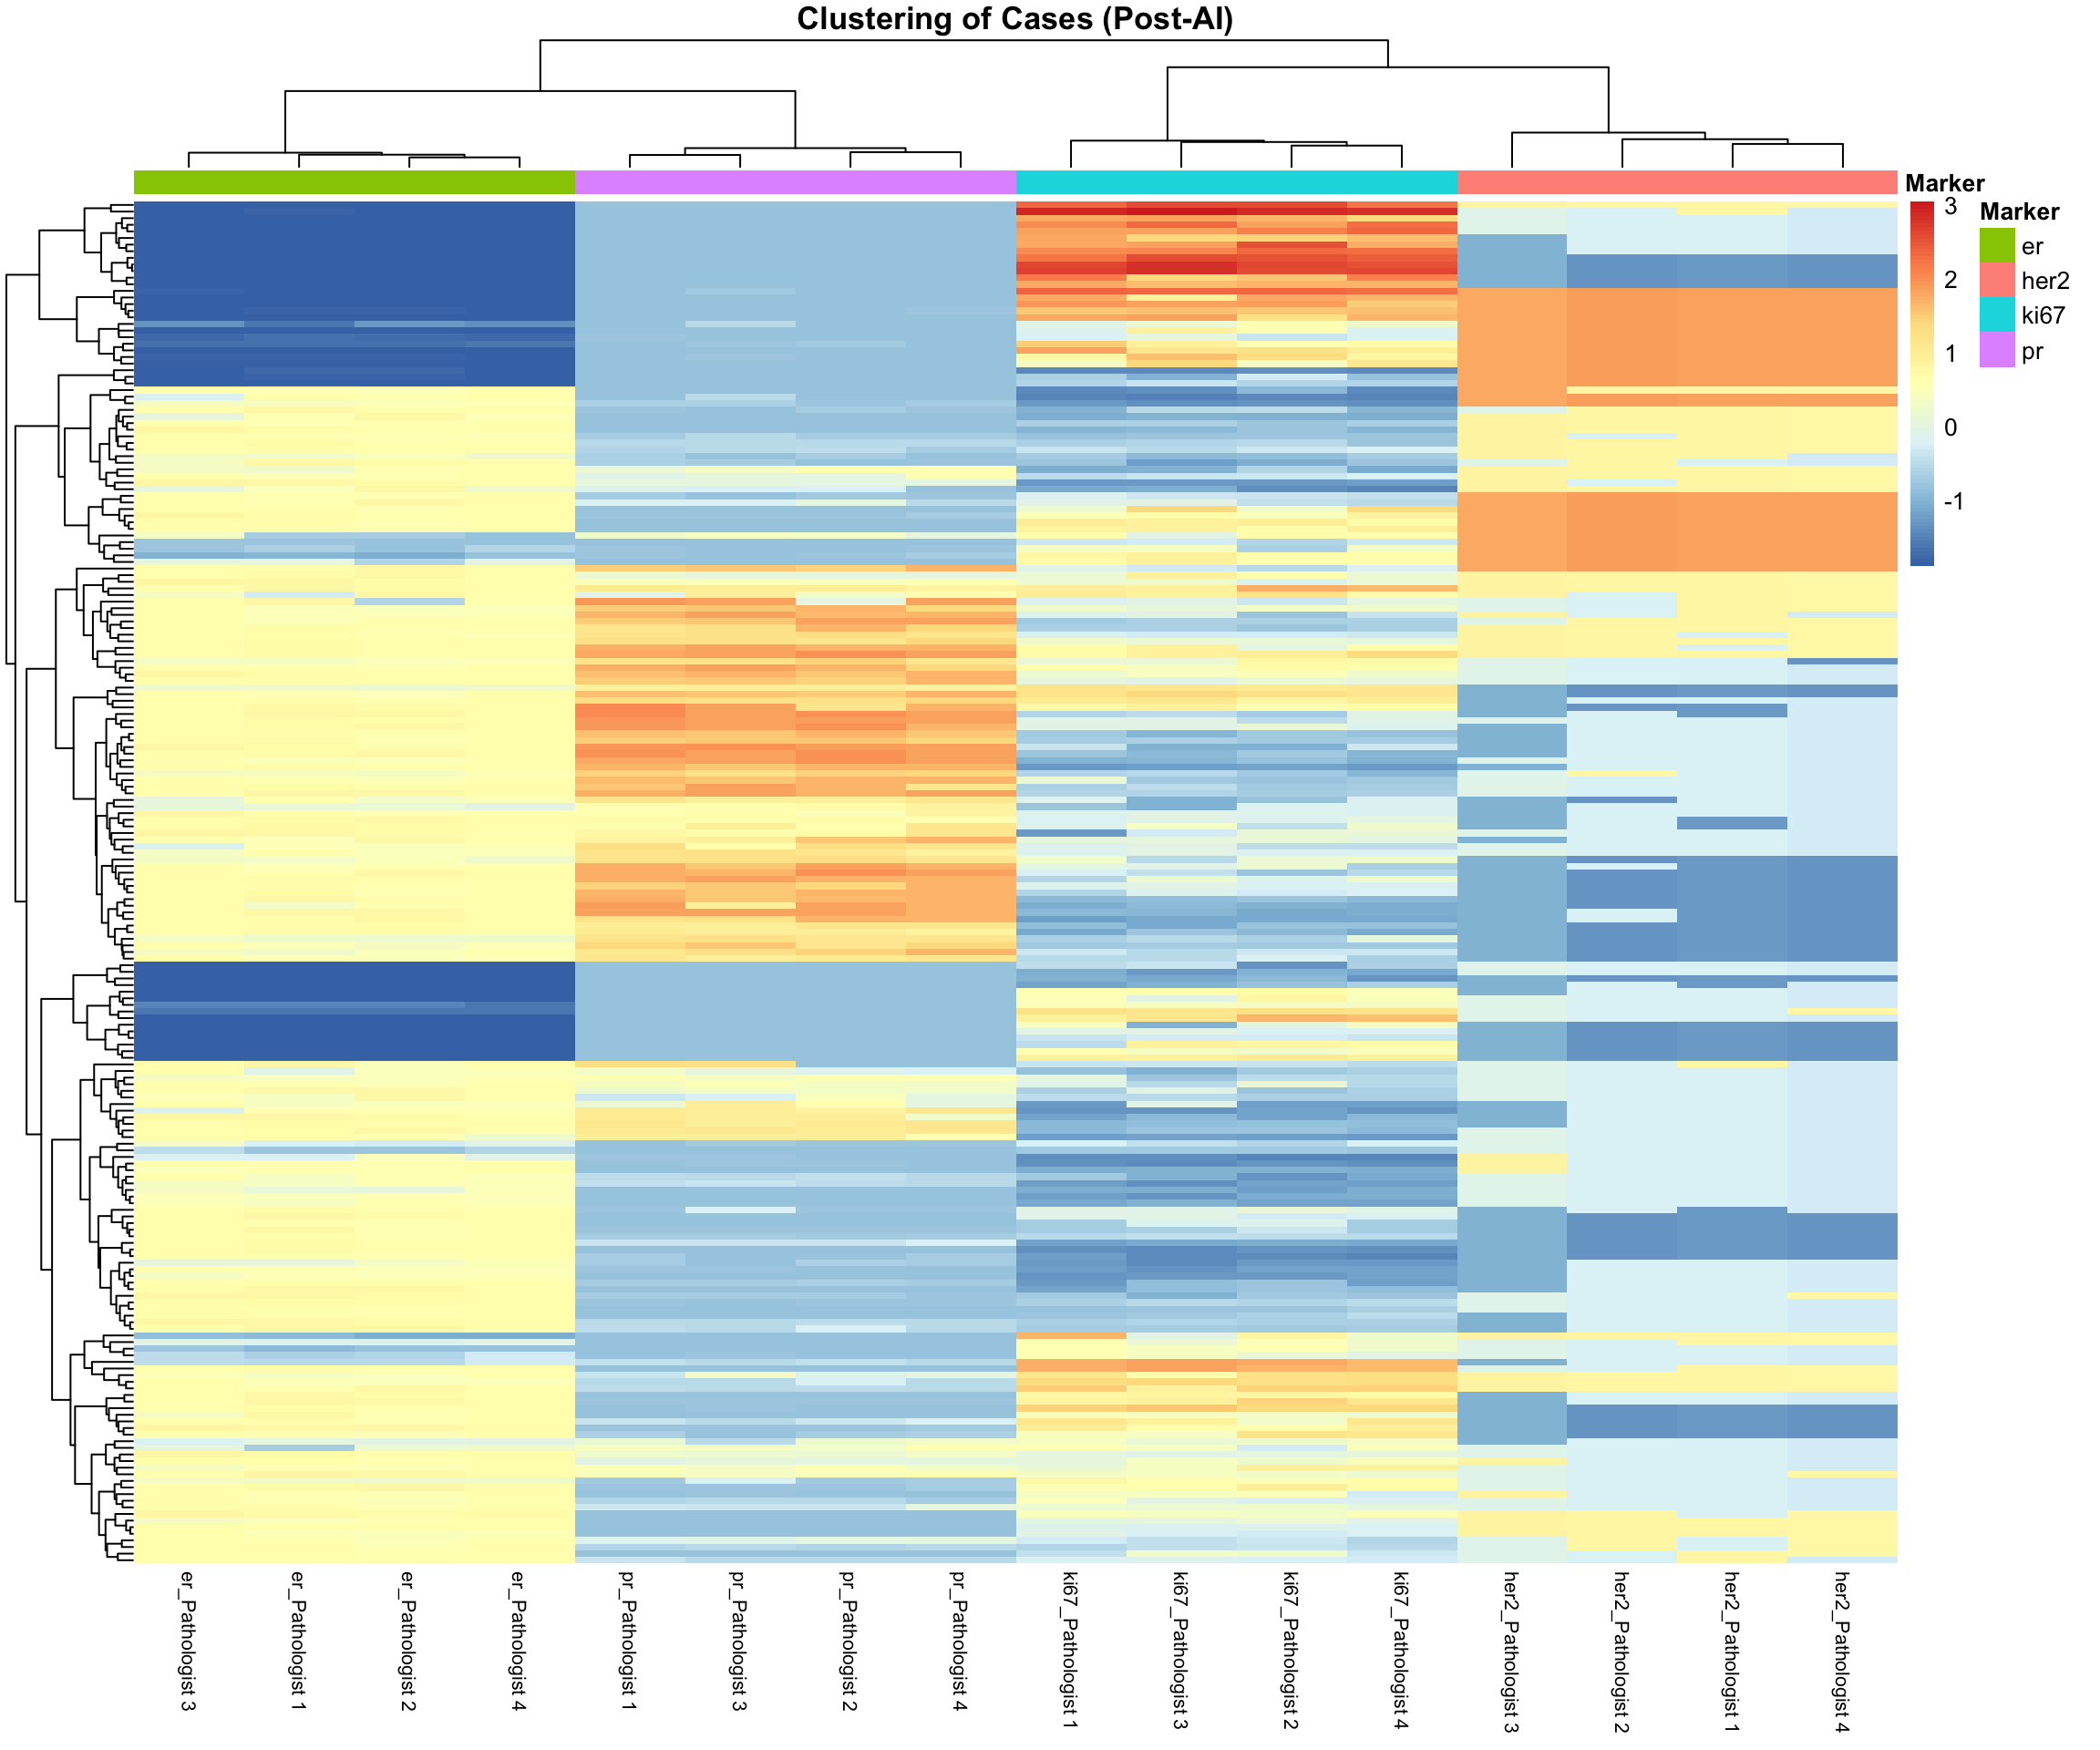
ER columns (ER_Path1, ER_Path2, etc.) should cluster tightly together, separate from PR, Ki67, and HER2.