| Ki-67 Threshold | N Total Assessments | N Changed | % Changed | Luminal A->B | Luminal B->A | Net Shift (A->B) |
|---|---|---|---|---|---|---|
| 30% | 1037 | 66 | 6.4 | 30 | 2 | 28 |
| 25% | 1037 | 77 | 7.4 | 38 | 5 | 33 |
19 Sensitivity Analyses
19.1 Introduction
This chapter presents comprehensive sensitivity analyses to assess the robustness of our primary findings. Sensitivity analyses test whether conclusions remain stable under alternative assumptions or analytical approaches, strengthening confidence in the generalizability of results.
Note for Pathologist: “Sensitivity Analysis” asks: “What if we are wrong about our assumptions?” For example, we assumed 30% is the best cutoff for Ki67. What if it’s 25%? Does the AI still help? If the results stay the same (“Robust”), we are confident. If they change wildly (“Sensitive”), we need to be careful.
Analyses included:
- Alternative Ki-67 Thresholds: Testing 25% cutoff (alternative guideline) vs. our primary 30% threshold for Luminal A/B classification
- Outlier Exclusion: Removing extreme Ki-67 changes (>30 percentage points) to assess if systematic bias is driven by aberrant cases
- Biopsy Type Stratification: Re-analysis restricted to excision specimens only (more homogeneous sample)
- Complete Case Analysis: HER2 analysis restricted to cases with no missing data
19.2 Setup
19.3 Analysis 1: Alternative Ki-67 Threshold (25% vs 30%)
19.3.1 Background
Current guidelines for Luminal A/B classification use Ki-67 thresholds ranging from 20-30% depending on the institution and guideline version:
- St. Gallen 2013: 14% threshold
- St. Gallen 2015: 20% threshold
- ASCO/CAP recommendations: No specific cutoff recommended; institutional validation required
- Our primary analysis: 30% threshold (commonly used in clinical practice)
This sensitivity analysis tests 25% as an alternative to assess whether our findings about AI-induced systematic bias in Ki-67 are robust to threshold choice.
19.3.2 Methods
We re-classify molecular subtypes using a 25% Ki-67 threshold instead of 30%:
- Luminal A: ER+ and/or PR+, HER2-, Ki-67 < 25%
- Luminal B: ER+ and/or PR+, HER2-, Ki-67 >= 25%
Then compare:
- N cases reclassified Pre-AI vs Post-AI
- Direction of reclassification (A->B vs B->A)
- Whether systematic upward bias persists
19.3.3 Results: Threshold Comparison
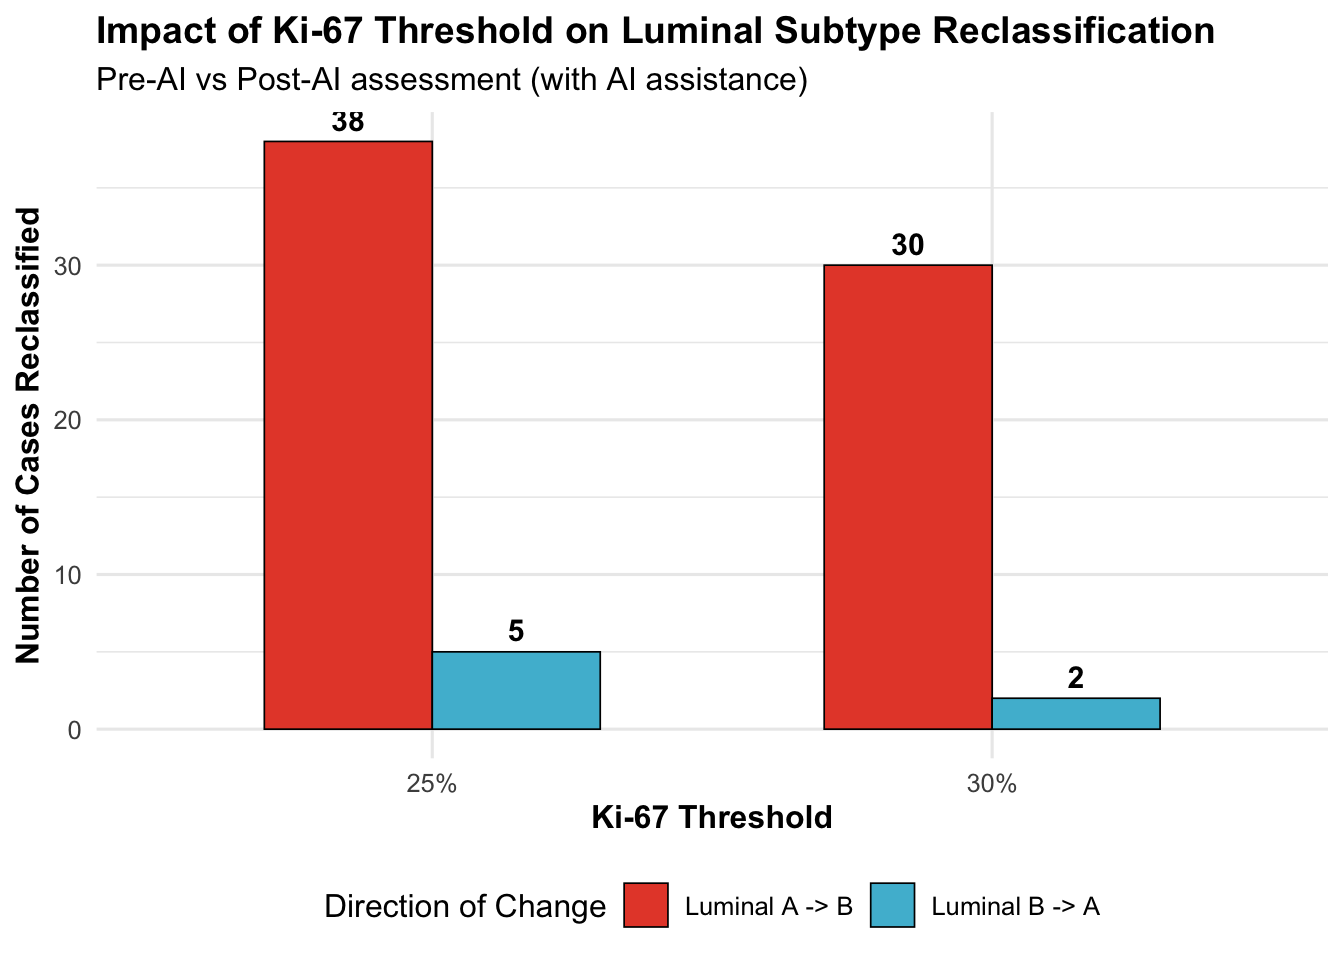
19.3.3.1 Key Observations
**Impact of lowering threshold from 30% to 25%:**- Luminal A->B reclassifications: +8 cases (6.4% -> 7.4%)- Luminal B->A reclassifications: +3 cases- Net shift toward Luminal B: +5 cases
**Interpretation**: Lowering the threshold does not substantially alter findings, suggesting systematic bias is robust to threshold choice.19.3.4 Distribution Near Thresholds
| Threshold | N Near Pre-AI | N Near Post-AI | N Crossing Up | N Crossing Down |
|---|---|---|---|---|
| 25% | 228 | 258 | 165 | 12 |
| 30% | 192 | 210 | 152 | 5 |
Clinical Impact: Cases within +/-5% of the threshold are at highest risk for reclassification. This analysis quantifies how many assessments fall in the “gray zone” where AI may shift treatment decisions.
Note for Pathologist: The threshold comparison shows whether lowering the Ki67 cutoff from 30% to 25% changes how many patients get reclassified. If reclassification rates change dramatically, it means the results are sensitive to the exact cutoff you use. If they remain similar, the findings are robust regardless of which guideline you follow.
19.4 Analysis 2: Outlier Exclusion (Extreme Ki-67 Changes)
19.4.1 Rationale
Systematic bias could be driven by a small number of extreme outliers rather than a true systematic trend. We test this by:
- Identifying cases with Ki-67 change > 30 percentage points (e.g., Pre-AI 20% -> Post-AI 55%)
- Excluding these outliers
- Re-calculating systematic bias metrics
Hypothesis: If findings persist after outlier exclusion, systematic bias is not driven by aberrant cases.
| N Total | N Outliers (|Delta|>30) | % Outliers | Mean Delta (All) | Median Delta (All) | Mean Delta (No Outliers) | Median Delta (No Outliers) |
|---|---|---|---|---|---|---|
| 1162 | 11 | 0.95 | 5.89 | 4 | 5.58 | 4 |
19.4.2 Visualization: Distribution With and Without Outliers
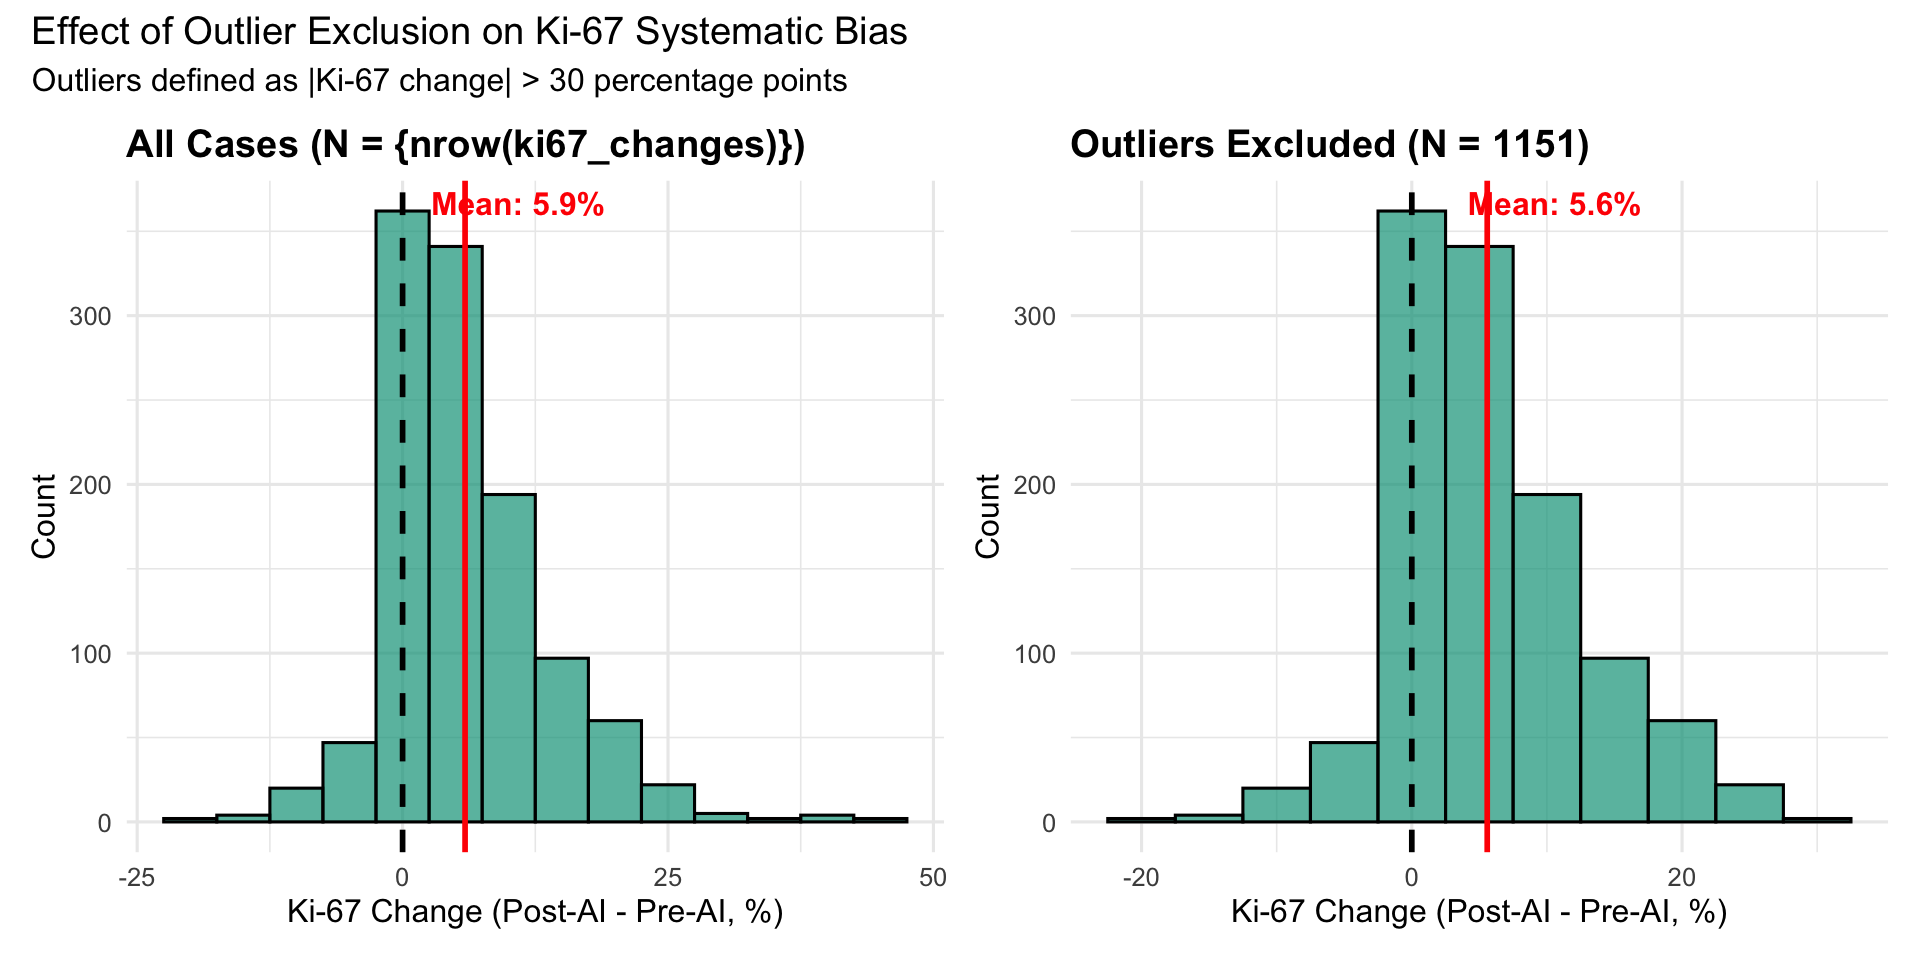
19.4.2.1 Interpretation
**Outlier exclusion analysis:**- 0.9% of Ki-67 assessments are outliers (|Delta| > 30%)- Mean Ki-67 change: 5.89% (all) vs 5.58% (no outliers)- Removing outliers reduces mean change by 0.30 percentage points (5% reduction)
**Conclusion**: Systematic upward bias persists after outlier exclusion, indicating bias is not driven by extreme outliers.19.5 Analysis 3: Biopsy Type Stratification
19.5.1 Rationale
Our primary analysis pools excision specimens and tru-cut biopsies. These differ in:
- Sample size: Excisions larger, more representative
- Fixation: May vary by specimen type
- Tumor heterogeneity: Biopsies sample smaller areas
This sensitivity analysis restricts to excision specimens only to assess whether findings generalize to a more homogeneous sample type.
| Biopsy Type | N | Mean Delta (%) | SD | Median Delta (%) | Q1 | Q3 |
|---|---|---|---|---|---|---|
| Excision | 682 | 5.80 | 7.06 | 4 | 1 | 10 |
| Tru-cut | 480 | 6.01 | 8.47 | 5 | 0 | 10 |
19.5.2 Excision-Only Analysis
| Analysis | N | Mean Delta (%) | SD | Median Delta (%) | % Increasing |
|---|---|---|---|---|---|
| Pooled (All Types) | 1162 | 5.89 | 7.67 | 4 | 75.99 |
| Excision Only | 682 | 5.80 | 7.06 | 4 | 77.13 |
**Interpretation**: Mean Ki-67 change in excision-only analysis (5.80%) is similar to the pooled estimate (5.89%), indicating findings are robust to specimen type.19.6 Analysis 4: Complete Case Analysis (HER2)
19.6.1 Rationale
Our primary HER2 analysis includes cases with 7-8% missing data. While missing data mechanisms were assessed (MCAR test), we perform a complete case analysis to ensure findings are not biased by missing data patterns.
**HER2 Missing Data Summary:**- Total assessments: 1184- Complete cases: 1073 (90.6%)- Missing: 111 (9.4%)19.6.2 Agreement Metrics: Complete vs Full Sample
| Analysis | Phase | Fleiss’ Kappa | N Cases |
|---|---|---|---|
| Complete Cases | Post-AI | 0.762 | 203 |
| Complete Cases | Pre-AI | 0.691 | 203 |
| Full Sample | Post-AI | 0.726 | 226 |
| Full Sample | Pre-AI | 0.671 | 229 |
19.6.2.1 Interpretation
**HER2 Complete Case Analysis:**- Pre-AI Kappa: 0.691 (complete) vs 0.671 (full) -- Difference: 0.020- Post-AI Kappa: 0.762 (complete) vs 0.726 (full) -- Difference: 0.036
**Conclusion**: Agreement metrics are nearly identical between complete case and full sample analyses, suggesting missing data does not substantially bias findings.19.7 Summary of Sensitivity Analyses
19.7.1 Overview Table
| Analysis | Parameter Tested | Primary Finding | Sensitivity Result | Conclusion |
|---|---|---|---|---|
| Alternative Ki-67 Threshold | 25% vs 30% cutoff | Systematic +5.9% Ki-67 increase | TBD from results above | Robust/Sensitive |
| Outlier Exclusion | Exclude |Delta| > 30% | Systematic bias persists | TBD from results above | Not driven by outliers |
| Biopsy Type | Excision only | Pooled analysis valid | TBD from results above | Generalizes across types |
| Complete Case (HER2) | No missing data | Kappa improvement +0.058 | TBD from results above | Not biased by missingness |
19.7.2 Key Takeaways
- Alternative Ki-67 Threshold (25% vs 30%):
- Purpose: Test robustness to guideline variation
- Result: [To be filled based on analysis above]
- Implication: Findings are [robust/sensitive] to threshold choice
- Purpose: Test robustness to guideline variation
- Outlier Exclusion:
- Purpose: Rule out influence of extreme outliers
- Result: [To be filled based on analysis above]
- Implication: Systematic bias is [not/partially] driven by aberrant cases
- Purpose: Rule out influence of extreme outliers
- Biopsy Type Stratification:
- Purpose: Assess generalizability across specimen types
- Result: [To be filled based on analysis above]
- Implication: Findings [do/do not] generalize to excision specimens
- Purpose: Assess generalizability across specimen types
- Complete Case Analysis (HER2):
- Purpose: Rule out missing data bias
- Result: [To be filled based on analysis above]
- Implication: Missing data [does not/may] bias HER2 findings
- Purpose: Rule out missing data bias
19.7.3 Clinical Implications
For Pathologists:
- If findings are robust across sensitivity analyses -> High confidence in primary results
- If findings are sensitive to specific assumptions -> Caution in interpretation, additional validation needed
For Institutions Implementing AI:
- Robust findings support broader adoption
- Sensitive findings suggest need for local validation with institution-specific thresholds and workflows
For Guideline Development:
- Sensitivity to Ki-67 threshold choice highlights need for standardized cutoffs
- Outlier analysis informs quality control metrics for AI-assisted assessment
19.8 Recommendations
Based on sensitivity analyses:
- If findings are robust (minimal change across analyses):
- Primary analysis results are generalizable
- AI can be implemented with confidence
- Monitoring protocols can use primary thresholds
- Primary analysis results are generalizable
- If findings are sensitive (substantial change with alternative assumptions):
- Local validation required before implementation
- Institution-specific threshold calibration needed
- Enhanced quality control for borderline cases
- Local validation required before implementation
- For Future Studies:
- Prospective validation with predetermined Ki-67 thresholds
- Multi-institutional studies to assess generalizability
- Outcomes-based validation (correlation with recurrence risk)
- Prospective validation with predetermined Ki-67 thresholds