| Pathologist | ER | PR | Ki-67 | HER2 |
|---|---|---|---|---|
| Pathologist 1 | 0.982 | 0.970 | 0.901 | 0.884 |
| Pathologist 2 | 0.987 | 0.975 | 0.961 | 0.763 |
| Pathologist 3 | 0.975 | 0.975 | 0.940 | 0.871 |
| Pathologist 4 | 0.996 | 0.992 | 0.955 | 0.931 |
20 Pathologist AI Adoption Profiling
20.1 Introduction
While aggregate statistics show AI improves interobserver agreement, individual pathologists demonstrate heterogeneous adoption patterns. Understanding these patterns is critical for:
Note for Pathologist: We know not everyone uses AI the same way. Some people trust it completely (“High Adopters”), others are skeptical (“Conservative”). This section groups pathologists into these categories to show how different user styles affect the results. It’s not about “Good vs Bad” pathologists, but “High vs Low” AI utilization.
- Personalized training: Identifying which pathologists benefit most from AI for which markers
- Quality assurance: Detecting over-reliance or under-utilization of AI suggestions
- Implementation strategies: Tailoring AI rollout based on user profiles
This chapter provides comprehensive individual-level analysis of pathologist AI adoption, moving beyond the aggregate polar plot (Figure 5 in manuscript) to formal statistical classification.
20.2 AI Adoption Indices
20.2.1 Correlation-Based Adoption Metrics
First, replicate the polar plot (Figure 5) data: correlation between Pre-AI and Post-AI assessments by pathologist and marker.
20.2.1.1 Interpretation
High correlation (r > 0.90): Pathologist maintains pre-AI assessments; minimal AI influence
Moderate correlation (r = 0.70-0.90): Selective AI adoption; modifies some cases
Low correlation (r < 0.70): Substantial AI influence; frequent modifications
20.2.2 Change Magnitude Index
Quantify absolute magnitude of changes made after viewing AI suggestions.
| pathologist | er_mean_abs_change | ki67_mean_abs_change | pr_mean_abs_change | er_pct_changed | ki67_pct_changed | pr_pct_changed |
|---|---|---|---|---|---|---|
| Pathologist 1 | 4.26 | 9.31 | 5.63 | 21.23 | 57.39 | 36.21 |
| Pathologist 2 | 3.46 | 4.99 | 4.60 | 14.29 | 32.99 | 26.41 |
| Pathologist 3 | 3.64 | 6.52 | 4.18 | 21.84 | 42.96 | 28.62 |
| Pathologist 4 | 0.96 | 6.71 | 2.04 | 5.41 | 48.63 | 16.27 |
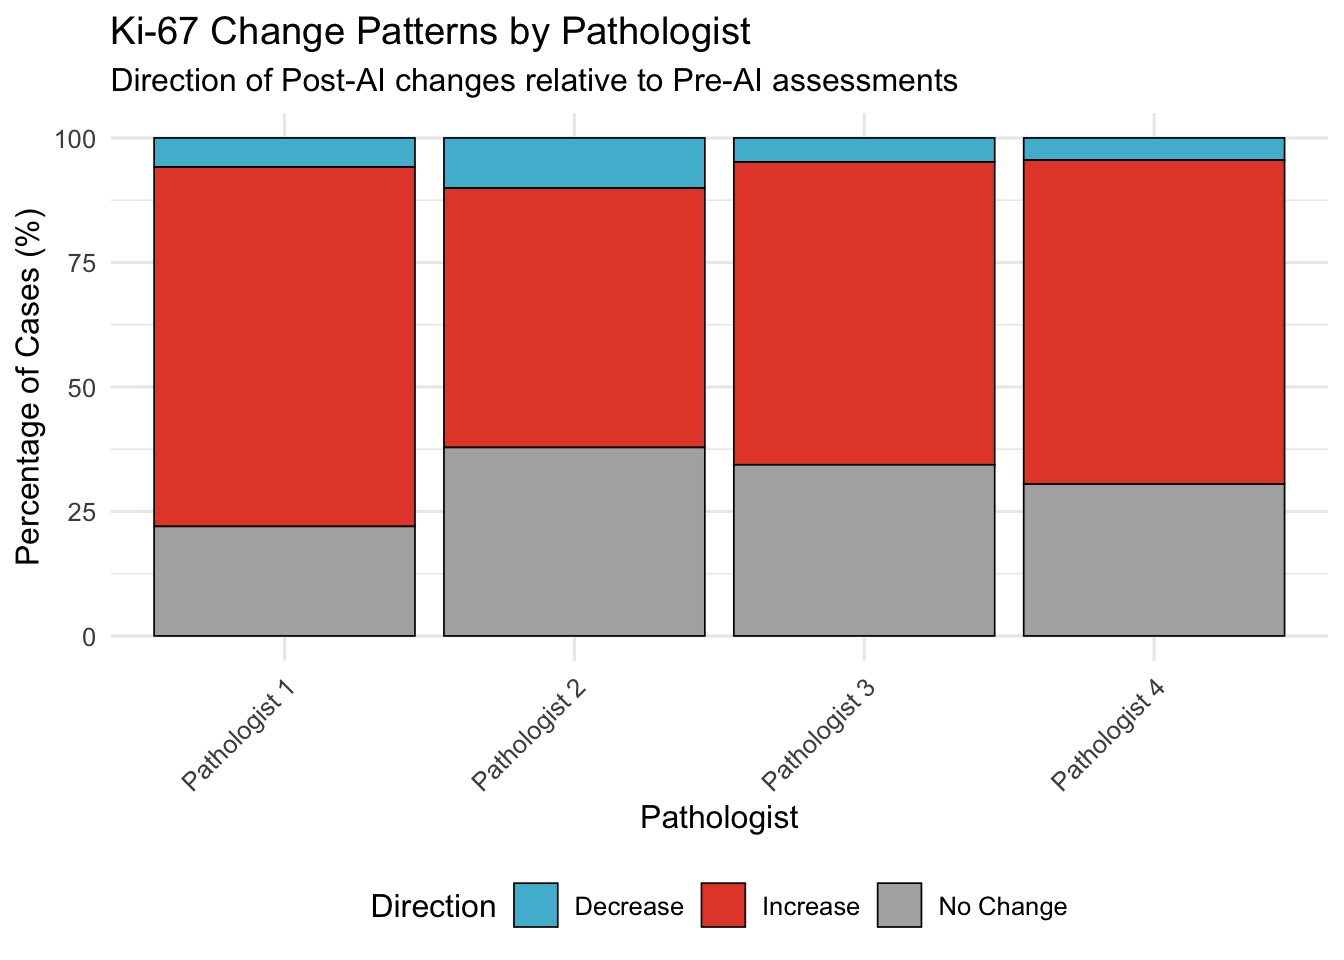
20.3 Direction Consistency Index
For Ki-67 (where systematic bias observed), assess if pathologists consistently move in same direction as AI or show variable patterns.
20.4 Latent Profile Analysis
20.4.1 Methodology
Use k-means clustering to classify pathologists into adoption archetypes based on:
Statistical caveat: With only N=4 pathologists, cluster assignments should be interpreted as descriptive characterizations rather than statistically robust classifications. K-means cannot reliably partition 4 data points; the resulting archetypes are illustrative of observed behavioral patterns, not formal statistical categories.
- Correlation with Pre-AI (retention of initial assessment)
- Mean absolute change magnitude (willingness to modify)
- Variance of changes (consistency)
- Marker-specific patterns (ER, PR, Ki-67, HER2)
20.4.2 Feature Engineering
| pathologist | er_correlation | ki67_correlation | pr_correlation | er_mean_abs_change | ki67_mean_abs_change | pr_mean_abs_change | er_sd_change | ki67_sd_change | pr_sd_change | er_mean_change | ki67_mean_change | pr_mean_change | her2_correlation |
|---|---|---|---|---|---|---|---|---|---|---|---|---|---|
| Pathologist 1 | 0.982 | 0.901 | 0.970 | 4.264 | 9.306 | 5.628 | 7.110 | 9.563 | 9.283 | -1.682 | 8.302 | -1.400 | 0.884 |
| Pathologist 2 | 0.988 | 0.960 | 0.976 | 3.462 | 4.990 | 4.595 | 5.957 | 6.136 | 8.239 | -1.422 | 3.399 | -1.968 | 0.763 |
| Pathologist 3 | 0.974 | 0.941 | 0.975 | 3.642 | 6.515 | 4.176 | 7.991 | 7.060 | 7.753 | 0.515 | 5.766 | -1.066 | 0.871 |
| Pathologist 4 | 0.996 | 0.955 | 0.992 | 0.956 | 6.705 | 2.037 | 3.323 | 6.698 | 4.629 | 0.044 | 6.048 | -0.051 | 0.931 |
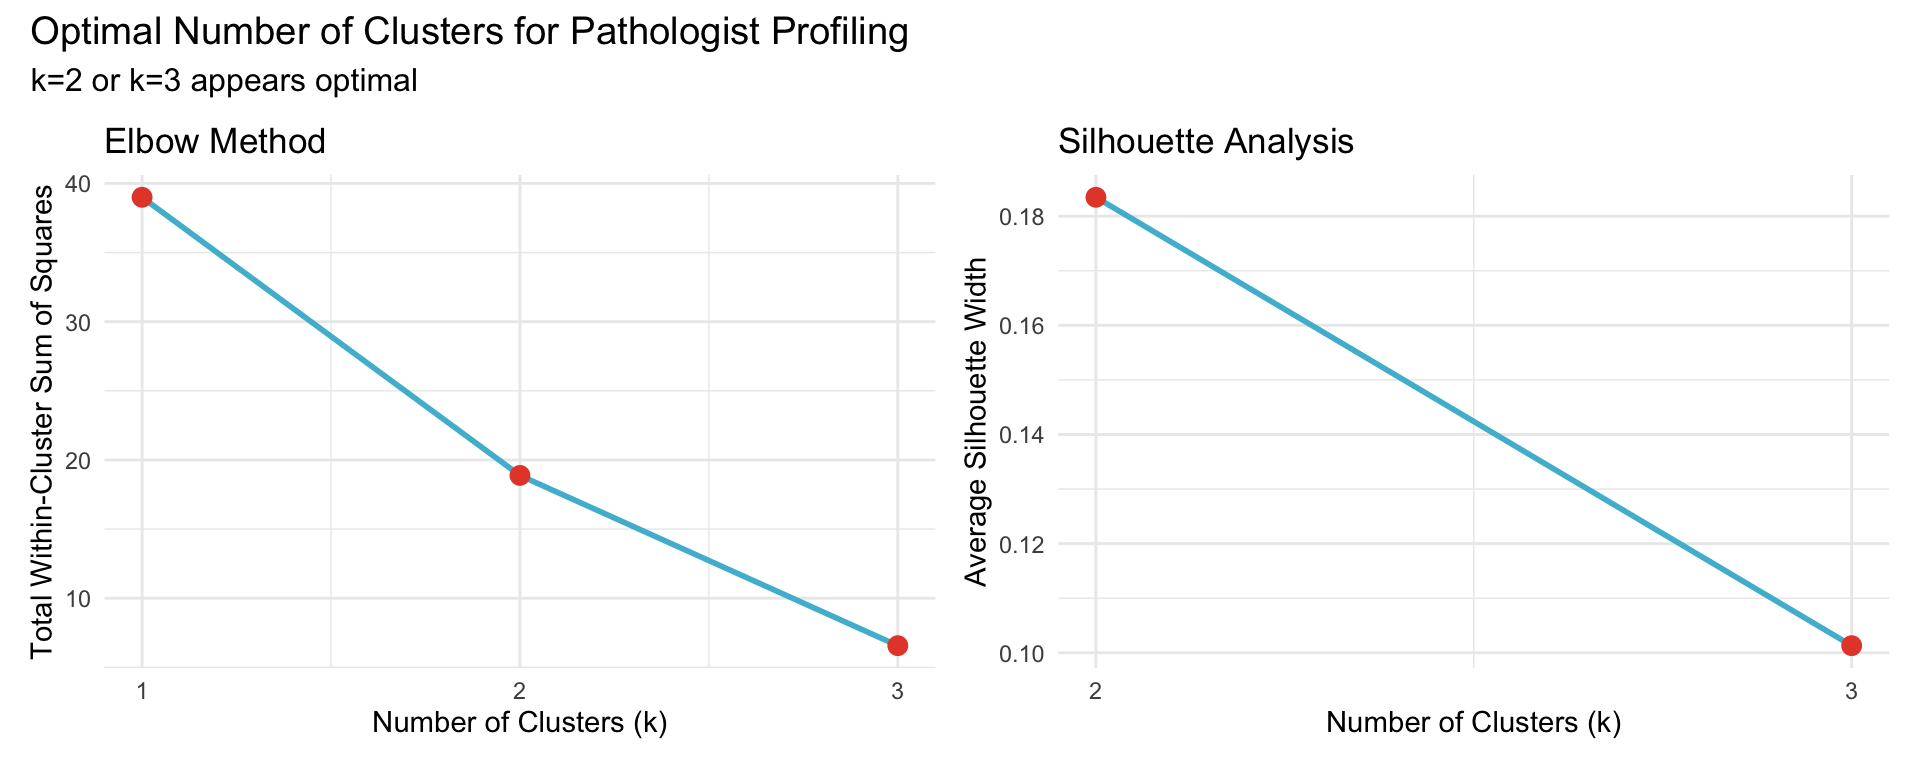
20.4.3 Optimal Number of Clusters
Use elbow method and silhouette analysis to determine optimal k.
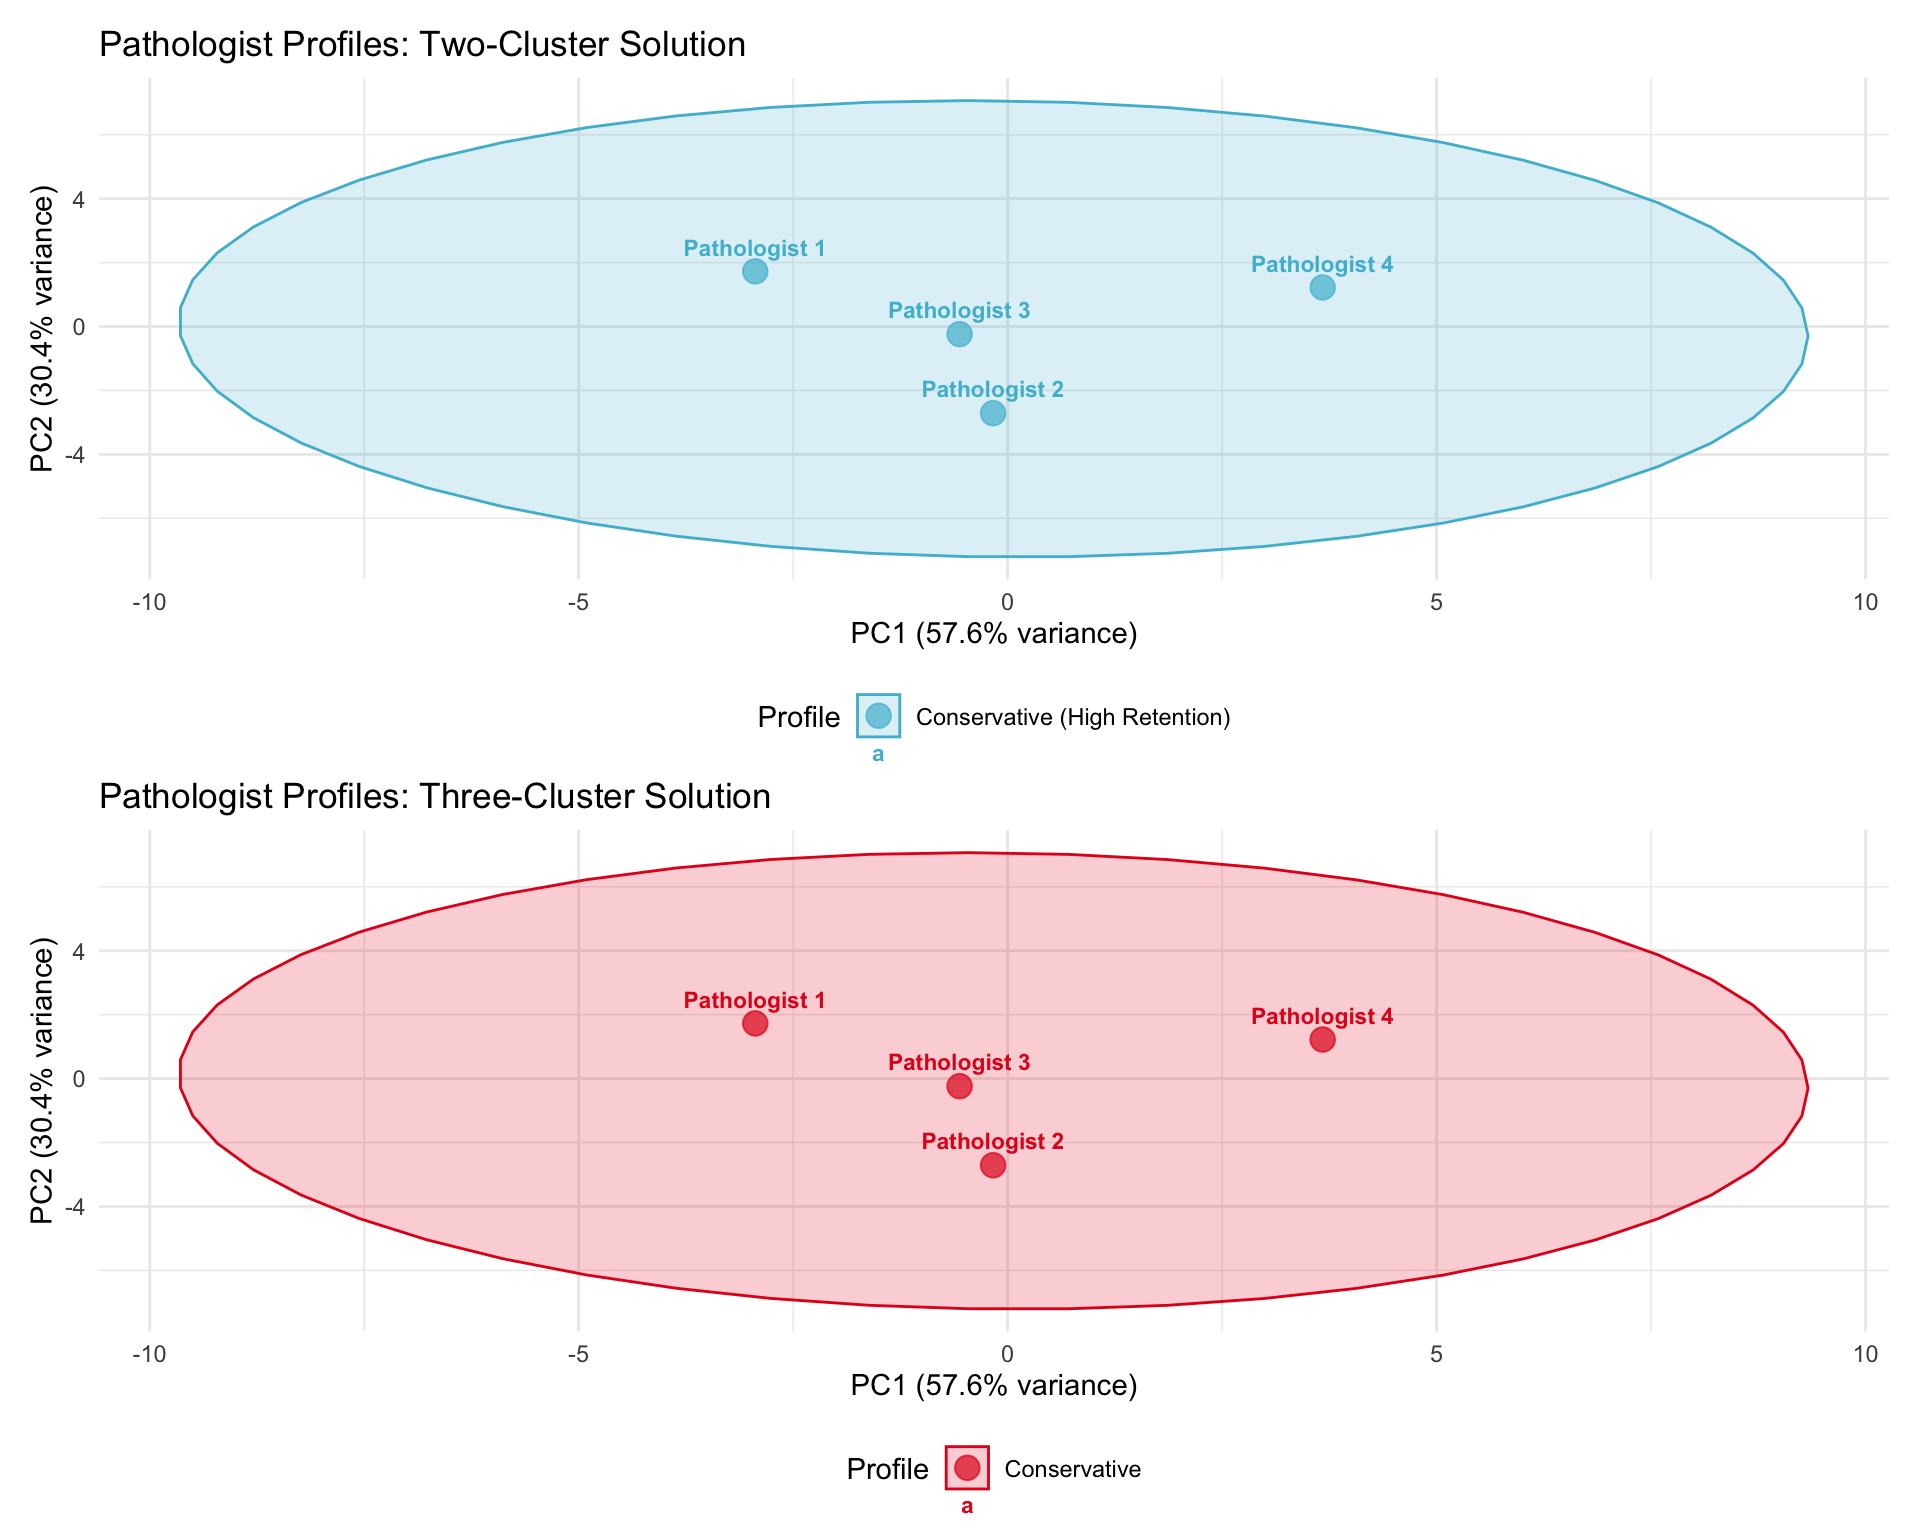
20.4.4 Cluster Assignments
Perform k-means with k=2 (conservative/adopter) and k=3 (conservative/moderate/adopter).
| Cluster | N Pathologists | Mean Correlation | Mean Abs Change | Profile Label |
|---|---|---|---|---|
| 1 | 3 | 0.932 | 5.175 | Conservative (High Retention) |
| 2 | 1 | 0.969 | 3.233 | Conservative (High Retention) |
| Pathologist | Cluster | Profile |
|---|---|---|
| Pathologist 1 | 1 | Conservative (High Retention) |
| Pathologist 2 | 1 | Conservative (High Retention) |
| Pathologist 3 | 1 | Conservative (High Retention) |
| Pathologist 4 | 2 | Conservative (High Retention) |
20.4.5 Three-Cluster Solution
| Cluster | N Pathologists | Mean Correlation | Mean Abs Change | Mean Ki-67 Δ | Profile Label |
|---|---|---|---|---|---|
| 2 | 1 | 0.969 | 3.233 | 6.048 | Conservative |
| 3 | 1 | 0.934 | 6.399 | 8.302 | Conservative |
| 1 | 2 | 0.931 | 4.563 | 4.583 | Conservative |
| Pathologist | Cluster | Profile |
|---|---|---|
| Pathologist 1 | 3 | Conservative |
| Pathologist 2 | 1 | Conservative |
| Pathologist 3 | 1 | Conservative |
| Pathologist 4 | 2 | Conservative |
20.4.6 Cluster Visualization
20.5 AI Override Rate
Definition: Percentage of cases where pathologist’s Post-AI assessment differs from their Pre-AI assessment by a clinically meaningful threshold.
20.5.1 Continuous Markers (ER, PR, Ki-67)
Threshold: >5 percentage points change
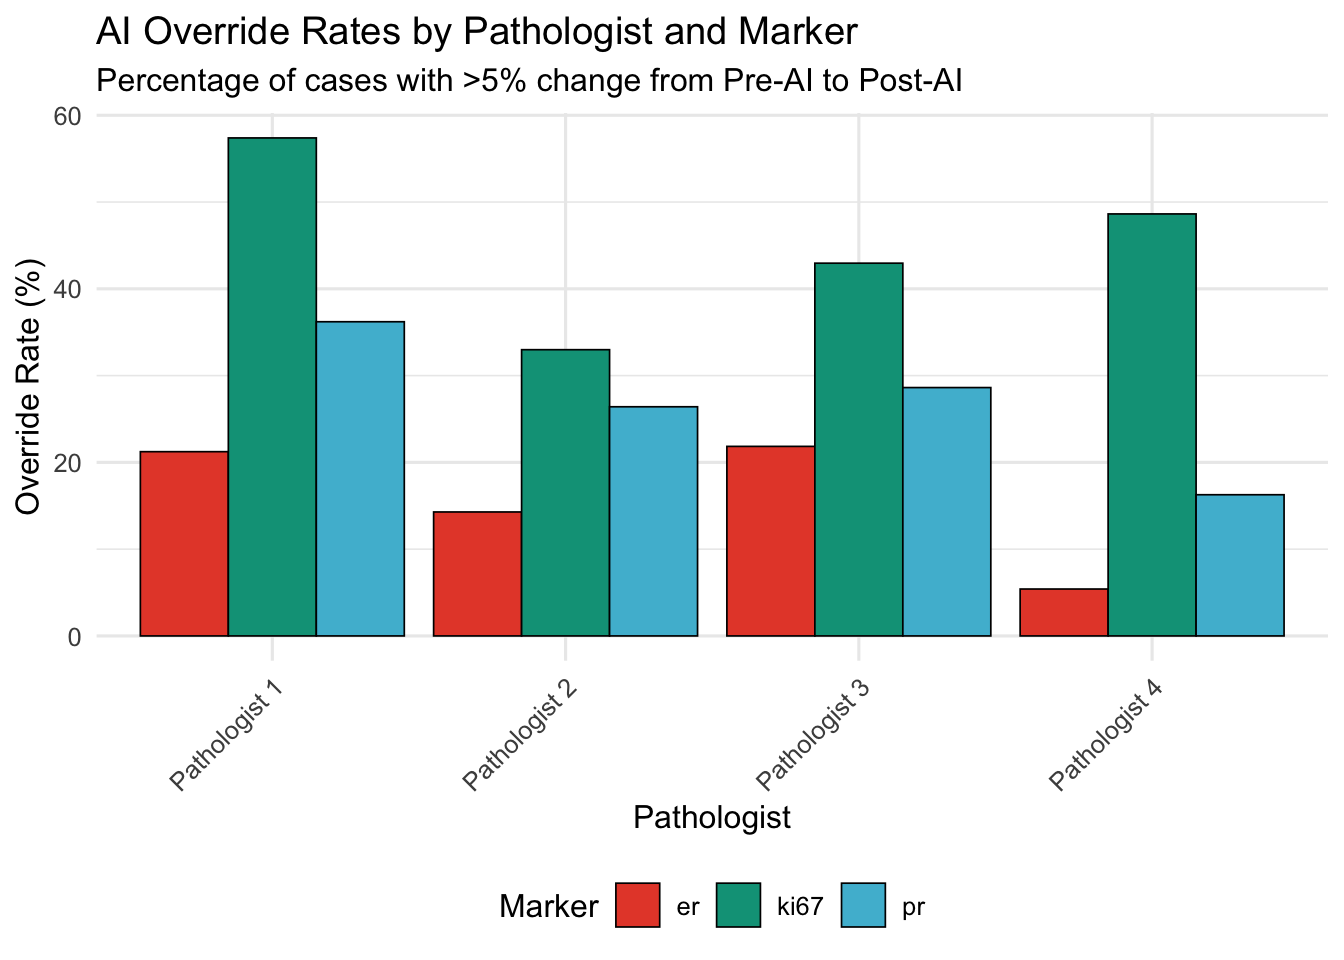
| Pathologist | ER | Ki-67 | PR |
|---|---|---|---|
| Pathologist 1 | 21.2 | 57.4 | 36.2 |
| Pathologist 2 | 14.3 | 33.0 | 26.4 |
| Pathologist 3 | 21.8 | 43.0 | 28.6 |
| Pathologist 4 | 5.4 | 48.6 | 16.3 |
20.5.2 Categorical Marker (HER2)
Override = any change in HER2 score (0 → 1+, 1+ → 2+, etc.)
| Pathologist | N Cases | N Overridden | Override Rate (%) |
|---|---|---|---|
| Pathologist 1 | 269 | 22 | 8.2 |
| Pathologist 2 | 290 | 45 | 15.5 |
| Pathologist 3 | 259 | 21 | 8.1 |
| Pathologist 4 | 255 | 11 | 4.3 |
20.5.2.1 Interpretation
High override rate (>30%): Frequent AI-driven modifications; may indicate:
- High trust in AI
- Uncertainty in initial assessments
- AI addressing genuine errors
Low override rate (<10%): Minimal AI influence; may indicate:
- High confidence in initial assessments
- Skepticism of AI suggestions
- High accuracy even without AI
20.6 Within-Pathologist Consistency
20.6.1 Variance Analysis
Compare variance of assessments Pre-AI vs Post-AI for each pathologist.
Hypothesis: If AI standardizes assessments, Post-AI variance should be lower.
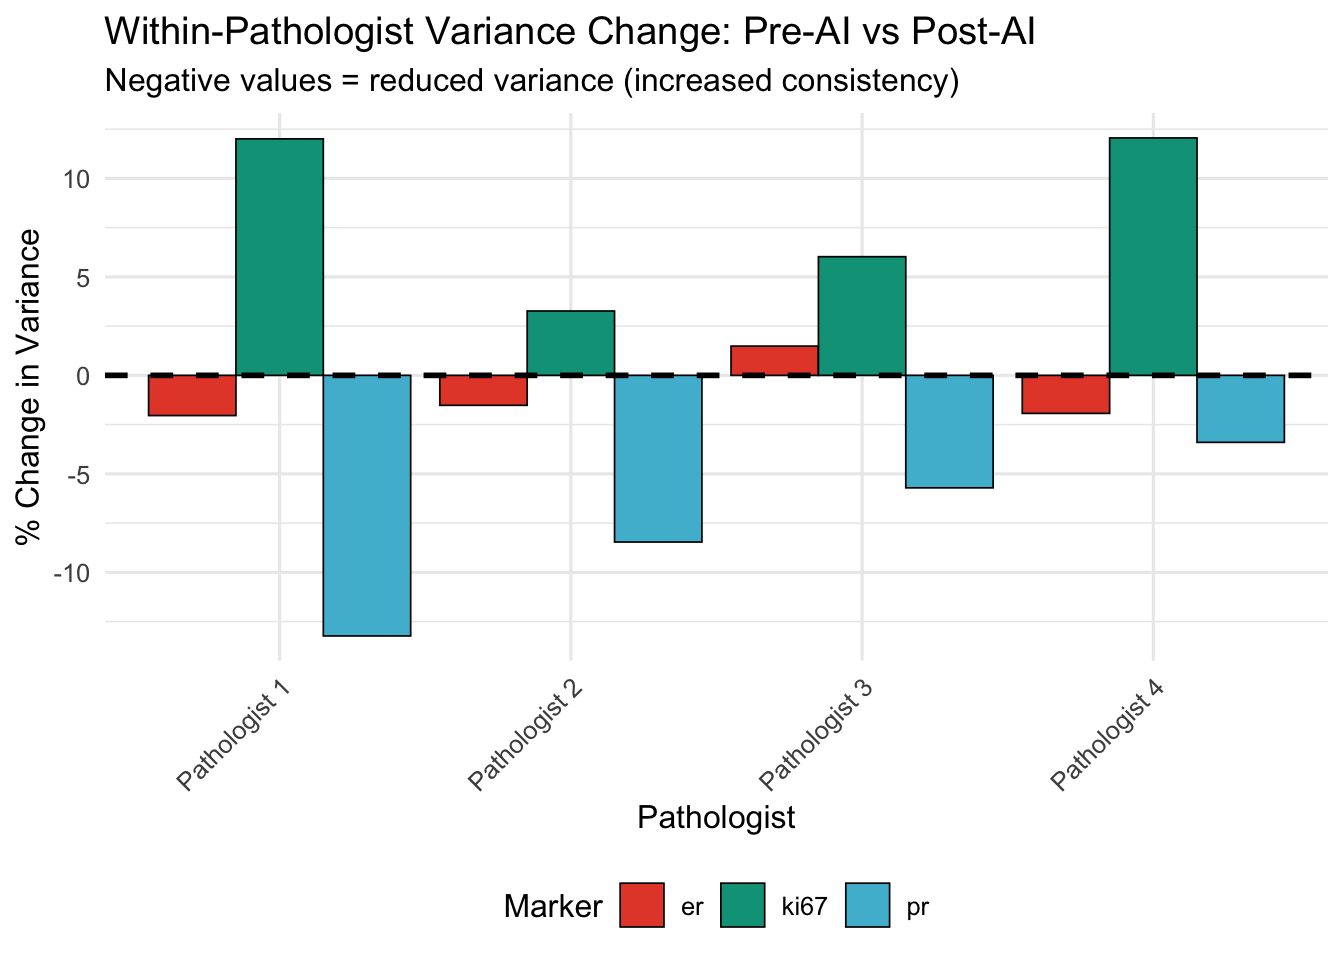
| Pathologist | Marker | Var (Pre) | Var (Post) | % Change |
|---|---|---|---|---|
| Pathologist 1 | er | 1386.44 | 1358.14 | -2.04 |
| Pathologist 1 | ki67 | 429.89 | 481.50 | 12.01 |
| Pathologist 1 | pr | 1408.34 | 1222.06 | -13.23 |
| Pathologist 2 | er | 1451.70 | 1429.62 | -1.52 |
| Pathologist 2 | ki67 | 466.38 | 481.61 | 3.27 |
| Pathologist 2 | pr | 1390.44 | 1272.79 | -8.46 |
| Pathologist 3 | er | 1209.40 | 1227.36 | 1.48 |
| Pathologist 3 | ki67 | 409.16 | 433.81 | 6.02 |
| Pathologist 3 | pr | 1195.47 | 1127.21 | -5.71 |
| Pathologist 4 | er | 1403.43 | 1376.34 | -1.93 |
| Pathologist 4 | ki67 | 458.74 | 514.03 | 12.05 |
| Pathologist 4 | pr | 1366.97 | 1320.48 | -3.40 |
20.6.2 Agreement with Group Median
Which pathologist is closest to group consensus (median)?
| Pathologist | Marker | Deviation (Pre-AI) | Deviation (Post-AI) |
|---|---|---|---|
| Pathologist 1 | er | 1.72 | 2.45 |
| Pathologist 1 | ki67 | 2.97 | 2.13 |
| Pathologist 1 | pr | 1.41 | 3.17 |
| Pathologist 2 | er | 2.12 | 3.43 |
| Pathologist 2 | ki67 | 3.11 | 4.10 |
| Pathologist 2 | pr | 2.02 | 4.07 |
| Pathologist 3 | er | 3.83 | 5.86 |
| Pathologist 3 | ki67 | 3.26 | 2.24 |
| Pathologist 3 | pr | 2.49 | 5.13 |
| Pathologist 4 | er | 1.87 | 2.26 |
| Pathologist 4 | ki67 | 2.27 | 1.80 |
| Pathologist 4 | pr | 2.52 | 3.03 |
| Pathologist | N Markers Converged (of 3) | Mean Convergence Magnitude |
|---|---|---|
| Pathologist 2 | 3 | 1.45 |
| Pathologist 3 | 2 | 1.21 |
| Pathologist 1 | 2 | 0.55 |
| Pathologist 4 | 2 | 0.14 |
20.7 Marker-Specific Adoption Patterns
20.7.1 Heatmap: Pathologist × Marker AI Adoption
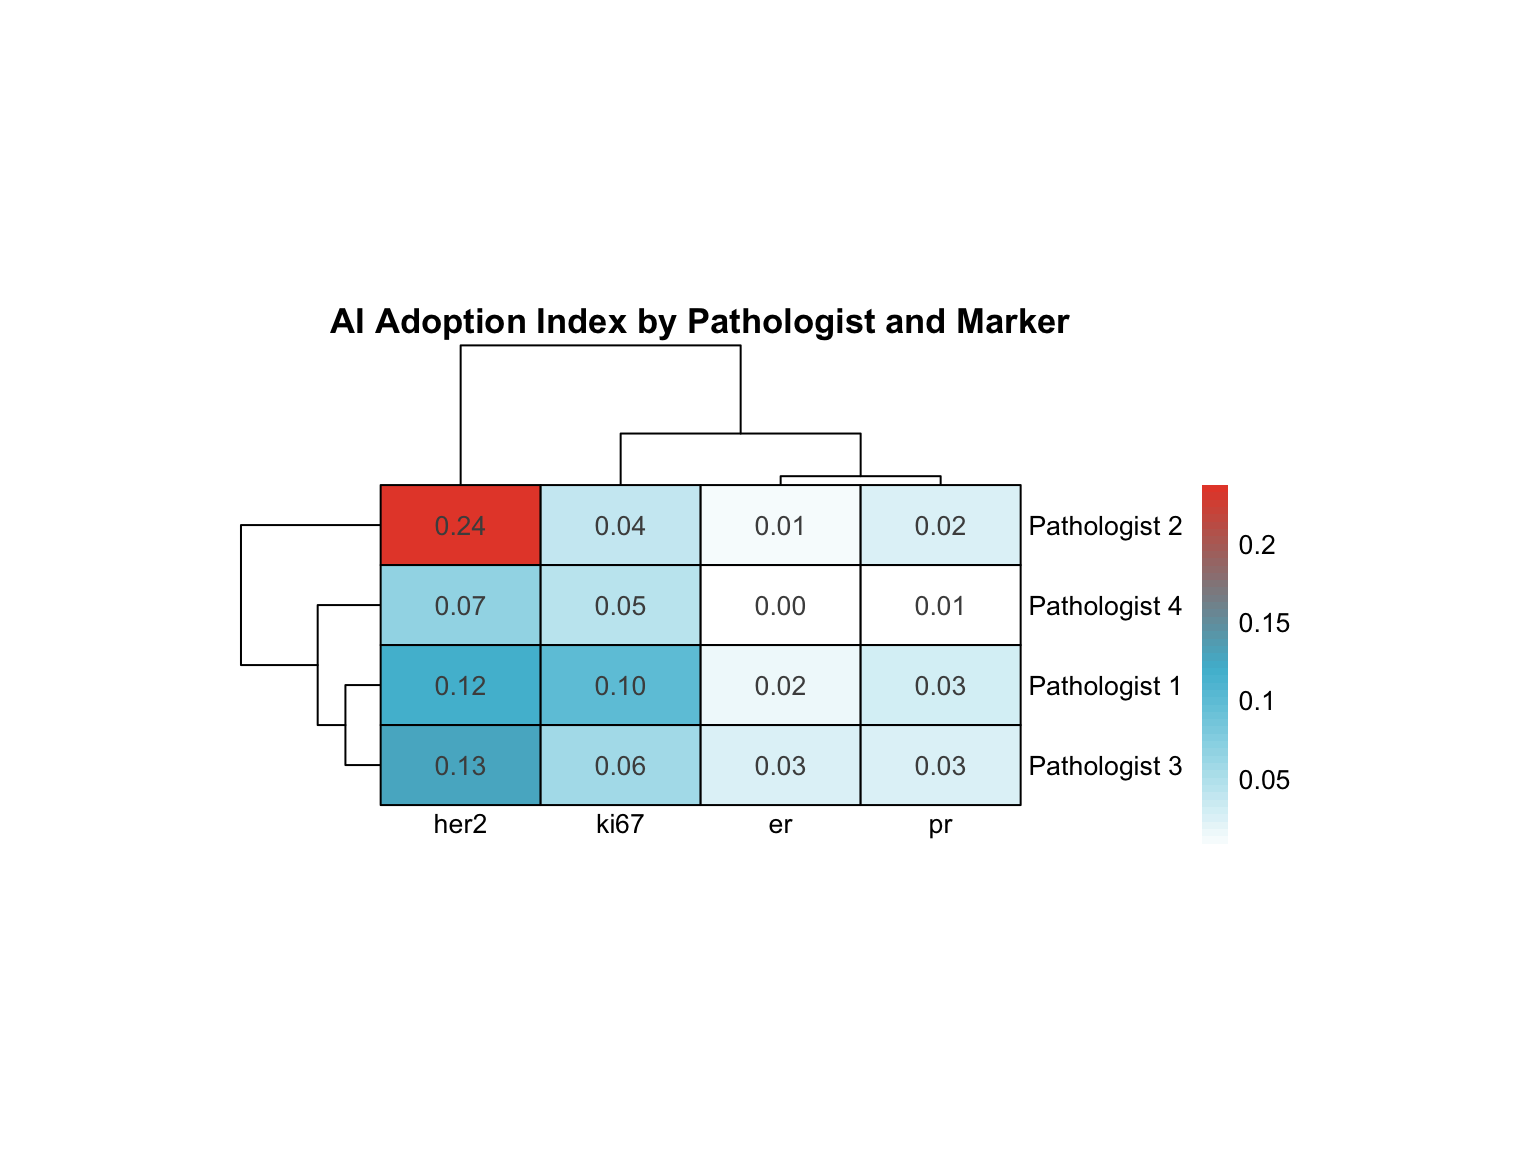
20.7.2 Specialized Profiling
Identify “marker specialists”: pathologists who adopt AI differentially for specific markers.
| Pathologist | Variance | Range | Highest AI Adoption | Lowest AI Adoption |
|---|---|---|---|---|
| Pathologist 2 | 0.011 | 0.225 | her2 | er |
| Pathologist 1 | 0.002 | 0.098 | her2 | er |
| Pathologist 3 | 0.002 | 0.104 | her2 | pr |
| Pathologist 4 | 0.001 | 0.065 | her2 | er |
Interpretation:
- High variance: Pathologist adopts AI selectively for specific markers (e.g., uses AI heavily for Ki-67 but not ER)
- Low variance: Uniform adoption pattern across all markers
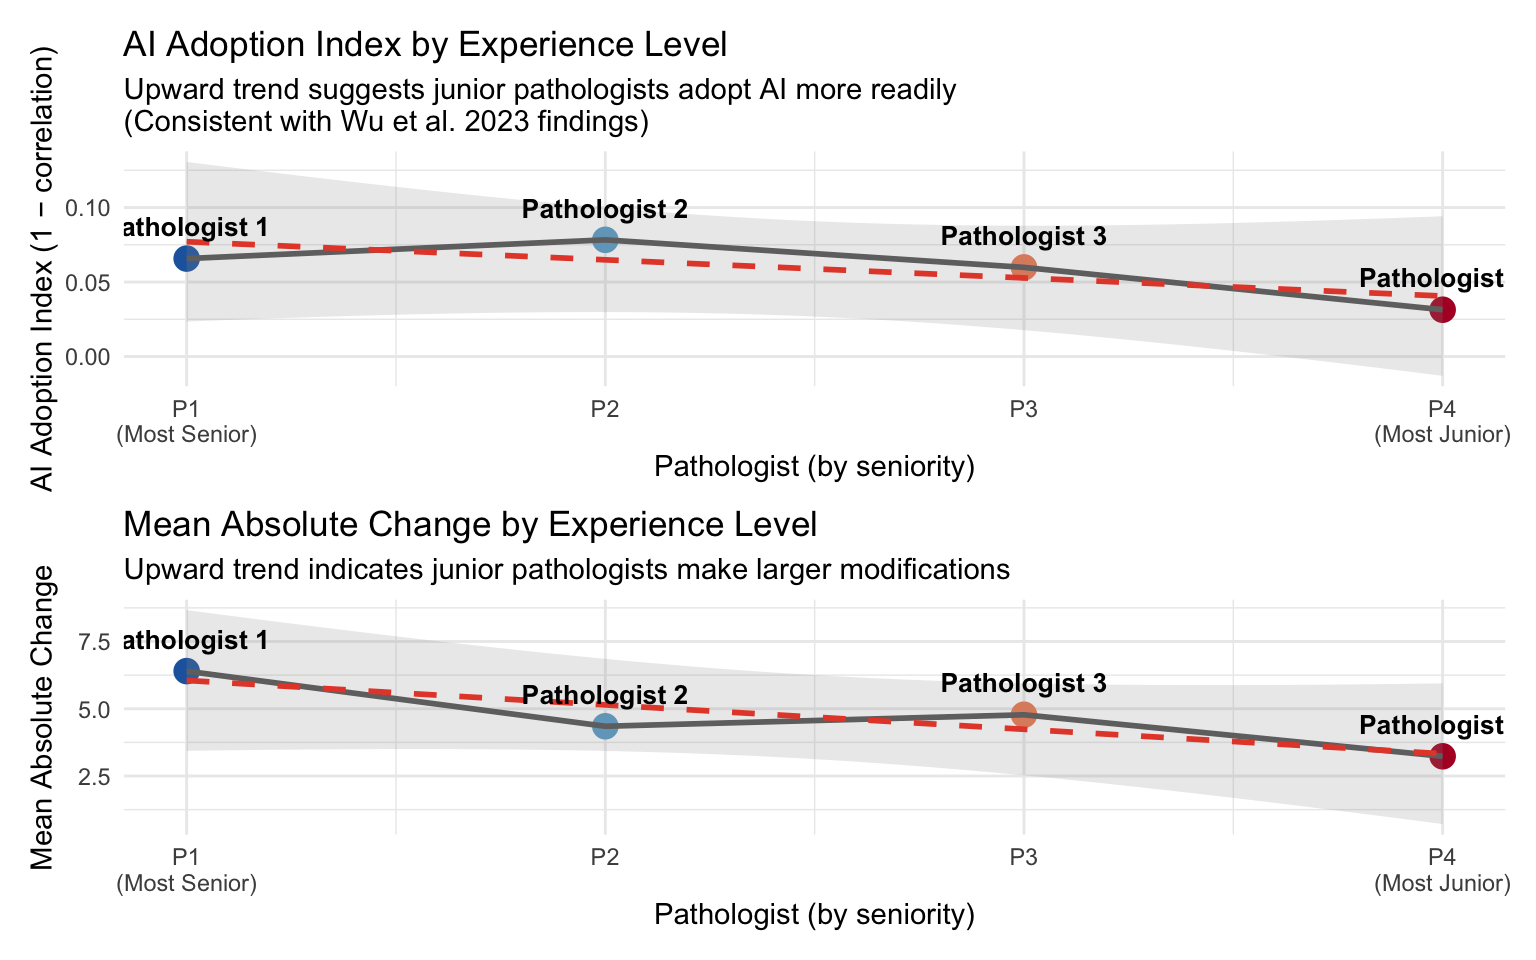
20.8 AI Adoption by Experience Level
Wu et al. (2023) found that junior pathologists benefited most from AI assistance, showing greater score modifications (Wu et al. 2023). We examine whether this pattern holds in our cohort.
Assumption: Pathologist 1 is the most senior and Pathologist 4 is the most junior (P1 → P2 → P3 → P4).
| AI Adoption Index by Experience Level | |||
| Higher adoption index = more AI influence on assessments | |||
| Pathologist | Seniority | Adoption Index (1−r) | Mean |Δ| |
|---|---|---|---|
| Pathologist 1 | Most Senior | 0.066 | 6.399 |
| Pathologist 2 | Senior | 0.078 | 4.349 |
| Pathologist 3 | Junior | 0.060 | 4.778 |
| Pathologist 4 | Most Junior | 0.031 | 3.233 |
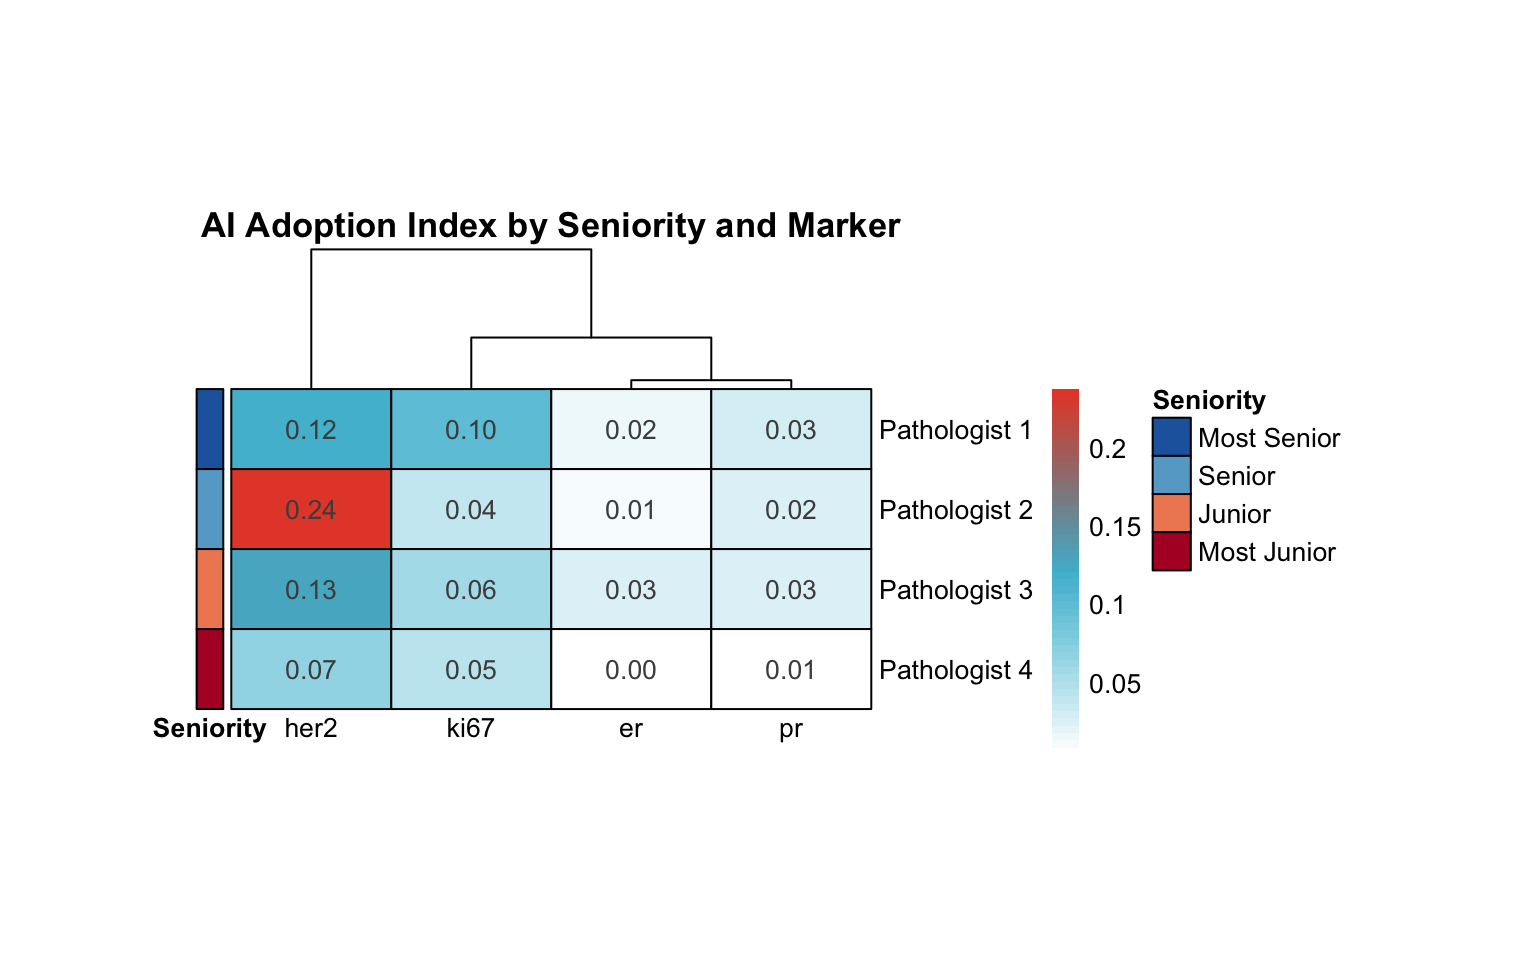
20.8.1 Seniority–Adoption Trend
20.8.2 Seniority in Adoption Heatmap
20.9 Summary: Pathologist Archetypes
20.9.1 Final Classification
Based on clustering, override rates, consistency metrics, and seniority:
| Pathologist | Cluster | Profile | Mean Override Rate (%) | Convergence to Median | Marker Specialization (Var) | Seniority |
|---|---|---|---|---|---|---|
| Pathologist 1 | 3 | Conservative | 38.28 | 0.55 | 0.00 | Most Senior |
| Pathologist 2 | 1 | Conservative | 24.56 | 1.45 | 0.01 | Senior |
| Pathologist 3 | 1 | Conservative | 31.14 | 1.21 | 0.00 | Junior |
| Pathologist 4 | 2 | Conservative | 23.44 | 0.14 | 0.00 | Most Junior |
20.9.2 Archetype Descriptions
| Profile | Characteristics | AI Relationship | Clinical Recommendations |
|---|---|---|---|
| Conservative | High retention of Pre-AI assessments, low override rates, minimal variance change | Selective AI use; trusts initial judgment | Review AI suggestions for outlier cases; may benefit from AI confidence scores |
| Moderate Adopter | Balanced override rates, moderate correlation, convergence toward group median | Pragmatic AI integration; considers AI as second opinion | Current approach optimal; continue monitoring quality metrics |
| High Adopter | Frequent modifications, low Pre-Post correlation, substantial variance reduction | High reliance on AI suggestions | Ensure critical thinking maintained; review cases where AI differs from initial assessment |
20.10 Clinical Implications
20.10.1 For Training Programs
- Conservative pathologists: May benefit from targeted training on AI interpretation, confidence calibration
- High adopters: May need emphasis on maintaining independent judgment, recognizing AI limitations
- Moderate adopters: Appear to balance AI as decision support tool optimally
- Seniority-aware training: Wu et al. (2023) found that junior pathologists benefited most from AI (Wu et al. 2023). Our data can inform whether AI should be deployed as a training tool for junior pathologists or as a quality check for senior pathologists
20.10.2 For Quality Assurance
- Monitor override rates: Sudden changes may indicate over-reliance or distrust
- Track convergence: Pathologists diverging from median warrant case review
- Marker-specific profiling: Tailor AI confidence displays based on pathologist’s marker expertise
- Experience-adjusted benchmarks: Override rate expectations may differ by seniority — higher rates for junior pathologists may be appropriate and expected
20.10.3 For AI System Design
- Personalized confidence thresholds: Show AI suggestions only when confidence exceeds pathologist-specific threshold
- Differential presentation: For “conservative” users, highlight discrepancies; for “high adopters”, emphasize agreement
- Audit trails: Flag cases where high adopters override significantly without review time
- Seniority-adaptive interface: Consider showing more AI detail (confidence intervals, supporting evidence) for junior pathologists and summarized results for experienced pathologists