Linear mixed model fit by REML. t-tests use Satterthwaite's method [
lmerModLmerTest]
Formula: value ~ marker * biopsy_type * modality + (1 | case_id) + (1 |
    pathologist)
   Data: model_data_continuous
Control: lmerControl(optimizer = "bobyqa", optCtrl = list(maxfun = 1e+05))

REML criterion at convergence: 66932.7

Scaled residuals:
     Min       1Q   Median       3Q      Max
-2.31471 -0.72276 -0.05804  0.72109  3.09315

Random effects:
 Groups      Name        Variance Std.Dev.
 case_id     (Intercept) 310.923  17.633
 pathologist (Intercept)   1.727   1.314
 Residual                721.354  26.858
Number of obs: 7034, groups:  case_id, 296; pathologist, 4

Fixed effects:
                                            Estimate Std. Error        df
(Intercept)                                  72.5793     1.8046   97.8409
markerki67                                  -49.1515     1.4439 6726.1895
markerpr                                    -39.0568     1.4408 6724.9778
biopsy_typeTru-cut                           -2.4236     2.6176  603.8967
modalitypost                                 -0.5042     1.4424 6725.0047
markerki67:biopsy_typeTru-cut                 6.9836     2.2475 6725.6397
markerpr:biopsy_typeTru-cut                  -2.8132     2.2463 6725.4058
markerki67:modalitypost                       6.3367     2.0458 6725.4757
markerpr:modalitypost                        -0.5471     2.0439 6725.4133
biopsy_typeTru-cut:modalitypost              -0.1281     2.2479 6725.1221
markerki67:biopsy_typeTru-cut:modalitypost    0.4515     3.1855 6725.1966
markerpr:biopsy_typeTru-cut:modalitypost      0.2564     3.1858 6725.2191
                                           t value Pr(>|t|)
(Intercept)                                 40.218  < 2e-16 ***
markerki67                                 -34.041  < 2e-16 ***
markerpr                                   -27.107  < 2e-16 ***
biopsy_typeTru-cut                          -0.926  0.35488
modalitypost                                -0.350  0.72667
markerki67:biopsy_typeTru-cut                3.107  0.00190 **
markerpr:biopsy_typeTru-cut                 -1.252  0.21048
markerki67:modalitypost                      3.097  0.00196 **
markerpr:modalitypost                       -0.268  0.78894
biopsy_typeTru-cut:modalitypost             -0.057  0.95455
markerki67:biopsy_typeTru-cut:modalitypost   0.142  0.88729
markerpr:biopsy_typeTru-cut:modalitypost     0.080  0.93587
---
Signif. codes:  0 '***' 0.001 '**' 0.01 '*' 0.05 '.' 0.1 ' ' 1

Correlation of Fixed Effects:
            (Intr) mrkr67 mrkrpr bps_T- mdltyp mr67:_T- mr:_T- mrk67: mrkrp:
markerki67  -0.398
markerpr    -0.399  0.499
bpsy_typTr- -0.598  0.275  0.275
modalitypst -0.399  0.498  0.499  0.275
mrkrk67:_T-  0.256 -0.642 -0.321 -0.428 -0.320
mrkrpr:b_T-  0.256 -0.320 -0.641 -0.428 -0.320  0.498
mrkrk67:mdl  0.281 -0.705 -0.352 -0.194 -0.705  0.453    0.226
mrkrpr:mdlt  0.281 -0.352 -0.705 -0.194 -0.706  0.226    0.452  0.498
bpsy_typT-:  0.256 -0.320 -0.320 -0.428 -0.642  0.498    0.498  0.452  0.453
mrkr67:_T-: -0.181  0.453  0.226  0.302  0.453 -0.705   -0.352 -0.642 -0.320
mrkrpr:_T-: -0.181  0.226  0.452  0.302  0.453 -0.351   -0.705 -0.319 -0.642
            bp_T-: m67:_T-:
markerki67
markerpr
bpsy_typTr-
modalitypst
mrkrk67:_T-
mrkrpr:b_T-
mrkrk67:mdl
mrkrpr:mdlt
bpsy_typT-:
mrkr67:_T-: -0.706
mrkrpr:_T-: -0.706 0.498 21 Interaction Effects Analysis
While main effects (e.g., “AI improves agreement”) are informative, interaction effects reveal when and for whom AI is most effective. Interaction effects address questions like:
- Marker × Biopsy Type: Does AI help more for tru-cut biopsies vs excisions?
- Marker × Pathologist: Do some pathologists benefit more from AI for specific markers?
- Threshold Proximity × AI: Does AI have greater impact near clinical decision thresholds?
- Baseline Agreement × AI: Does AI help more when initial disagreement is high?
This chapter provides formal statistical tests for interaction effects, extending the descriptive findings already reported in the manuscript (e.g., Table 5: marker × biopsy type opposing patterns).
Note for Pathologist: “Interaction” asks: “Does the AI effect depend on something else?” For example, does AI help more for biopsies than excisions? Or does it help Pathologist A more than Pathologist B? This tells us if a “one-size-fits-all” approach works, or if we need tailored instructions.
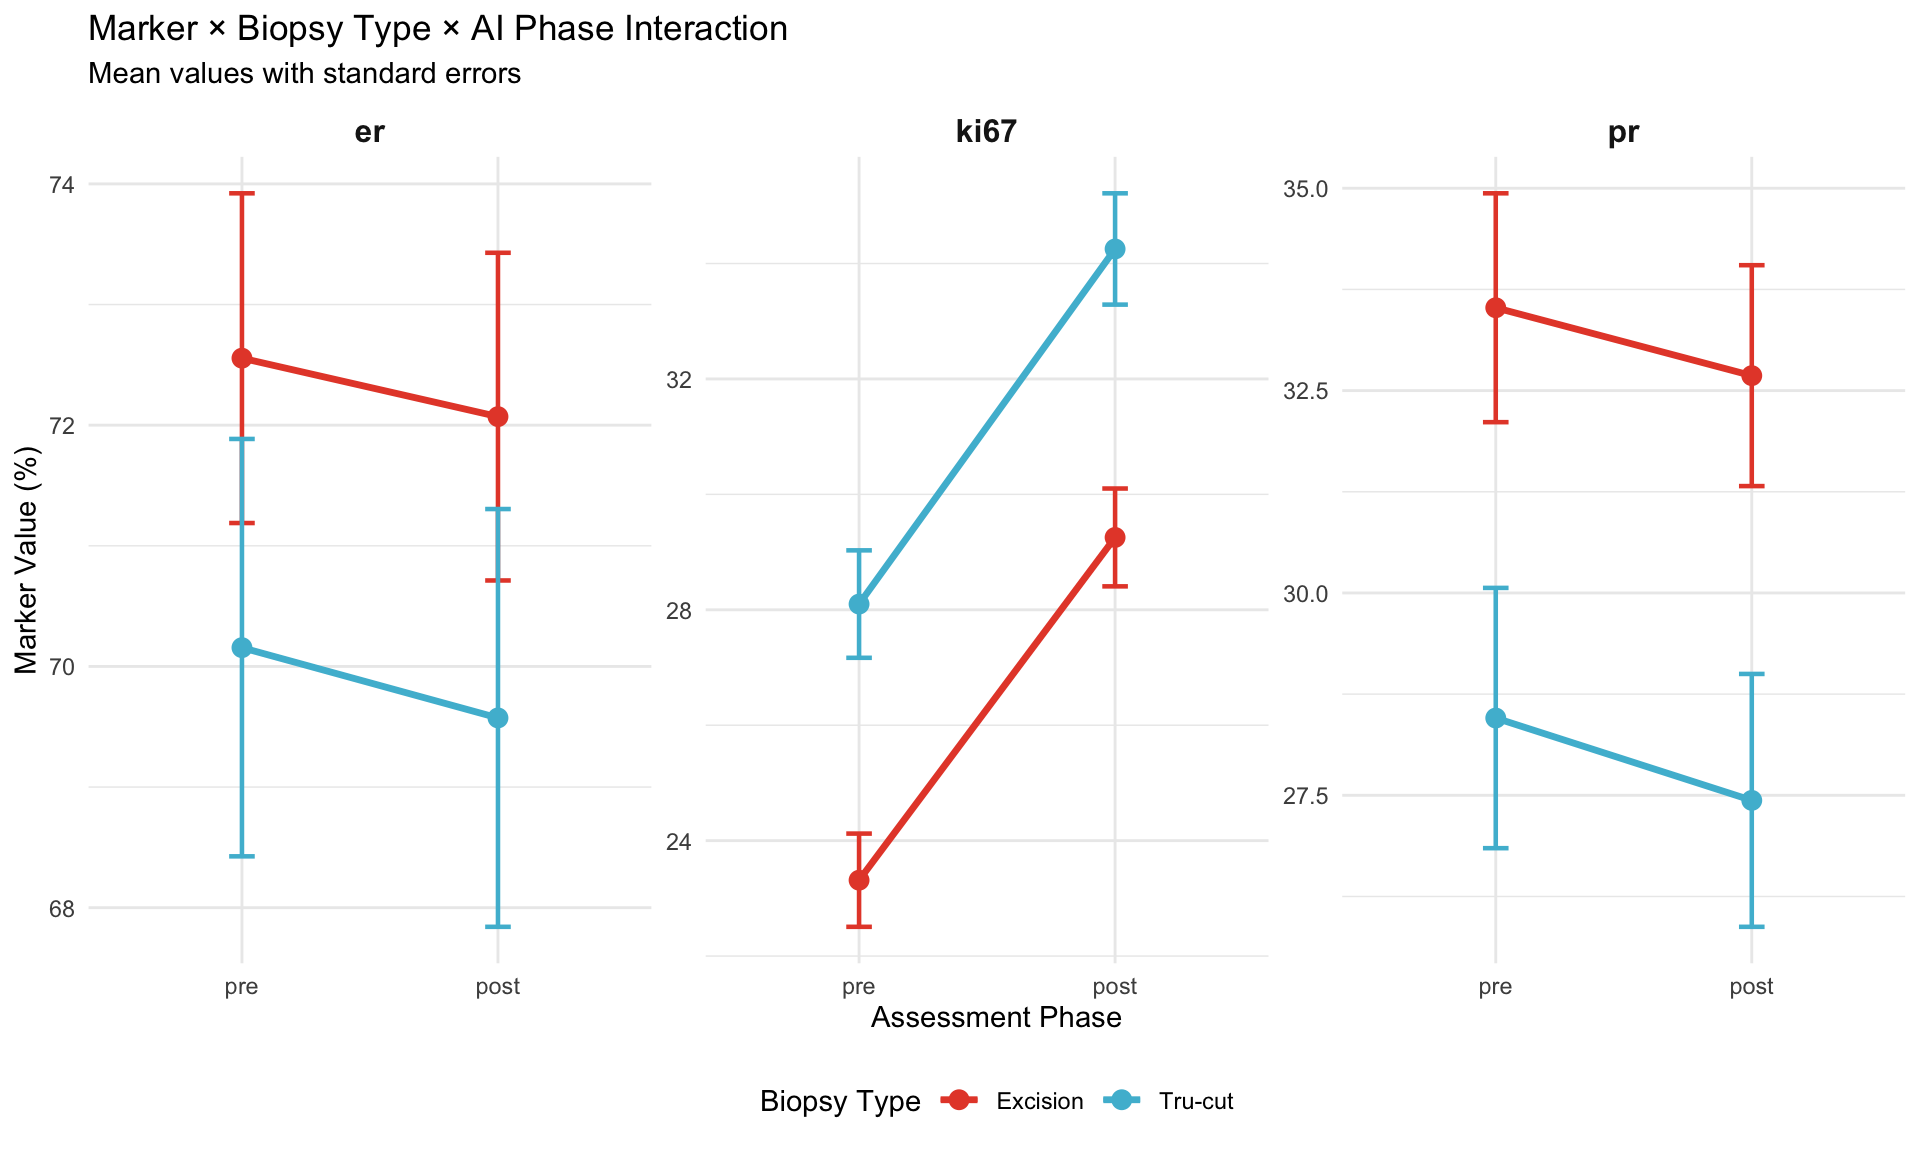
21.1 Marker × Biopsy Type Interaction
21.1.1 Background
Primary finding (reported in manuscript Table 5): Ki-67 shows increased agreement for tru-cut biopsies but decreased agreement for excisions, while ER/PR show opposite pattern.
Hypothesis: Specimen type moderates AI effect differently by marker.
21.1.2 Mixed Model Specification
21.1.3 ANOVA Table
Test significance of interaction terms.
| Sum Sq | Mean Sq | NumDF | DenDF | F value | Pr(>F) | |
|---|---|---|---|---|---|---|
| marker | 2620631.7071 | 1310315.8535 | 2 | 6726.9349 | 1816.4680 | 0.0000 |
| biopsy_type | 145.4153 | 145.4153 | 1 | 293.8481 | 0.2016 | 0.6538 |
| modality | 3728.1659 | 3728.1659 | 1 | 6725.6422 | 5.1683 | 0.0230 |
| marker:biopsy_type | 29617.9187 | 14808.9593 | 2 | 6726.9407 | 20.5294 | 0.0000 |
| marker:modality | 17382.3318 | 8691.1659 | 2 | 6725.2877 | 12.0484 | 0.0000 |
| biopsy_type:modality | 4.9500 | 4.9500 | 1 | 6725.6229 | 0.0069 | 0.9340 |
| marker:biopsy_type:modality | 14.5854 | 7.2927 | 2 | 6725.2764 | 0.0101 | 0.9899 |
Note for Pathologist: The ANOVA table tests whether AI’s effect depends on what you are measuring (ER vs Ki67) and what type of specimen you are scoring (excision vs tru-cut). Look at the “Pr(>F)” column: values below 0.05 indicate the interaction is statistically significant. A significant three-way interaction means you cannot make a blanket statement like “AI improves all markers equally for all specimen types.”
21.1.4 Interpretation
Three-way interaction (marker:biopsy_type:modality):
- If p < 0.05: AI effect (Pre vs Post change) varies by marker AND depends on biopsy type
- If p > 0.05: No significant three-way interaction; two-way interactions sufficient
21.1.5 Post-Hoc Contrasts
Test specific comparisons of interest using emmeans.
| Marker | Biopsy Type | Contrast | Estimate | SE | df | t ratio | p value |
|---|---|---|---|---|---|---|---|
| pre - post | er | Excision | 0.504 | 1.442 | Inf | 0.350 | 0.727 |
| pre - post | ki67 | Excision | -5.833 | 1.451 | Inf | -4.020 | 0.000 |
| pre - post | pr | Excision | 1.051 | 1.448 | Inf | 0.726 | 0.468 |
| pre - post | er | Tru-cut | 0.632 | 1.724 | Inf | 0.367 | 0.714 |
| pre - post | ki67 | Tru-cut | -6.156 | 1.729 | Inf | -3.560 | 0.000 |
| pre - post | pr | Tru-cut | 0.923 | 1.732 | Inf | 0.533 | 0.594 |
21.1.6 Visualization: Interaction Plot
21.1.7 Marker × Pathologist Interaction
21.1.7.1 Research Question
Does AI effect vary by pathologist differently for each marker?
Clinical implication: Personalized AI recommendations (e.g., “Pathologist A benefits most from AI for Ki-67”).
21.1.7.2 Model Specification
| Sum Sq | Mean Sq | NumDF | DenDF | F value | Pr(>F) | |
|---|---|---|---|---|---|---|
| marker | 2733792.675 | 1366896.3375 | 2 | 6717.081 | 1882.7697 | 0.0000 |
| pathologist | 11186.814 | 3728.9378 | 3 | 6715.622 | 5.1363 | 0.0015 |
| modality | 3772.699 | 3772.6992 | 1 | 6715.572 | 5.1965 | 0.0227 |
| marker:pathologist | 2912.318 | 485.3864 | 6 | 6715.243 | 0.6686 | 0.6751 |
| marker:modality | 17822.797 | 8911.3983 | 2 | 6715.324 | 12.2746 | 0.0000 |
| pathologist:modality | 1271.718 | 423.9059 | 3 | 6715.322 | 0.5839 | 0.6255 |
| marker:pathologist:modality | 1302.197 | 217.0329 | 6 | 6715.026 | 0.2989 | 0.9376 |
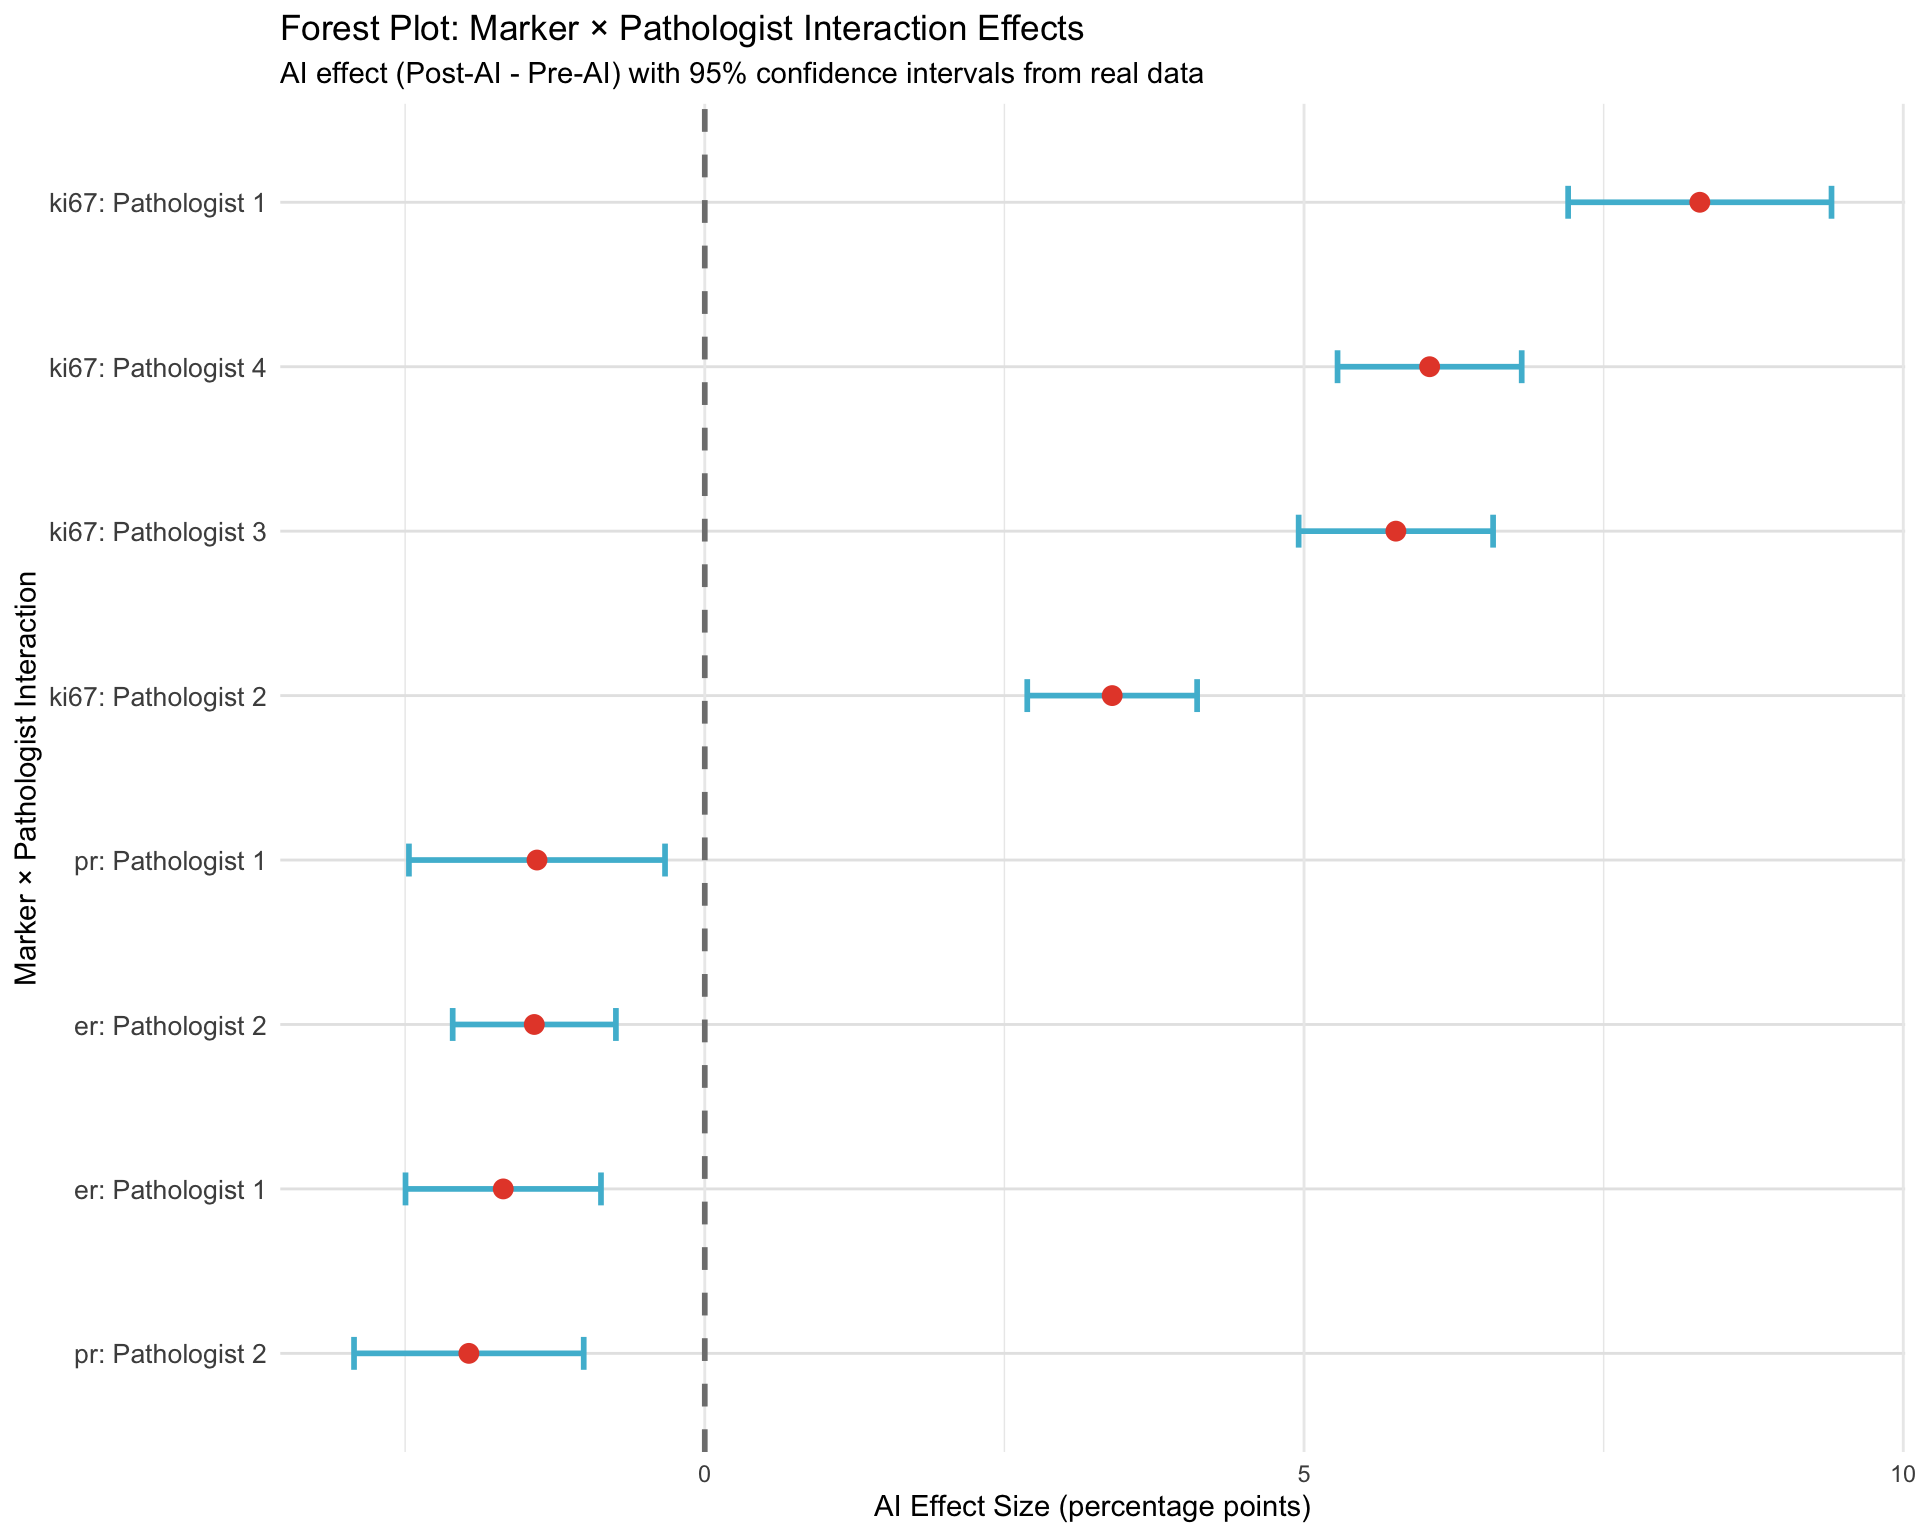
21.1.7.3 Pathologist-Specific AI Effects
Extract AI effect (Post - Pre) for each pathologist and marker.
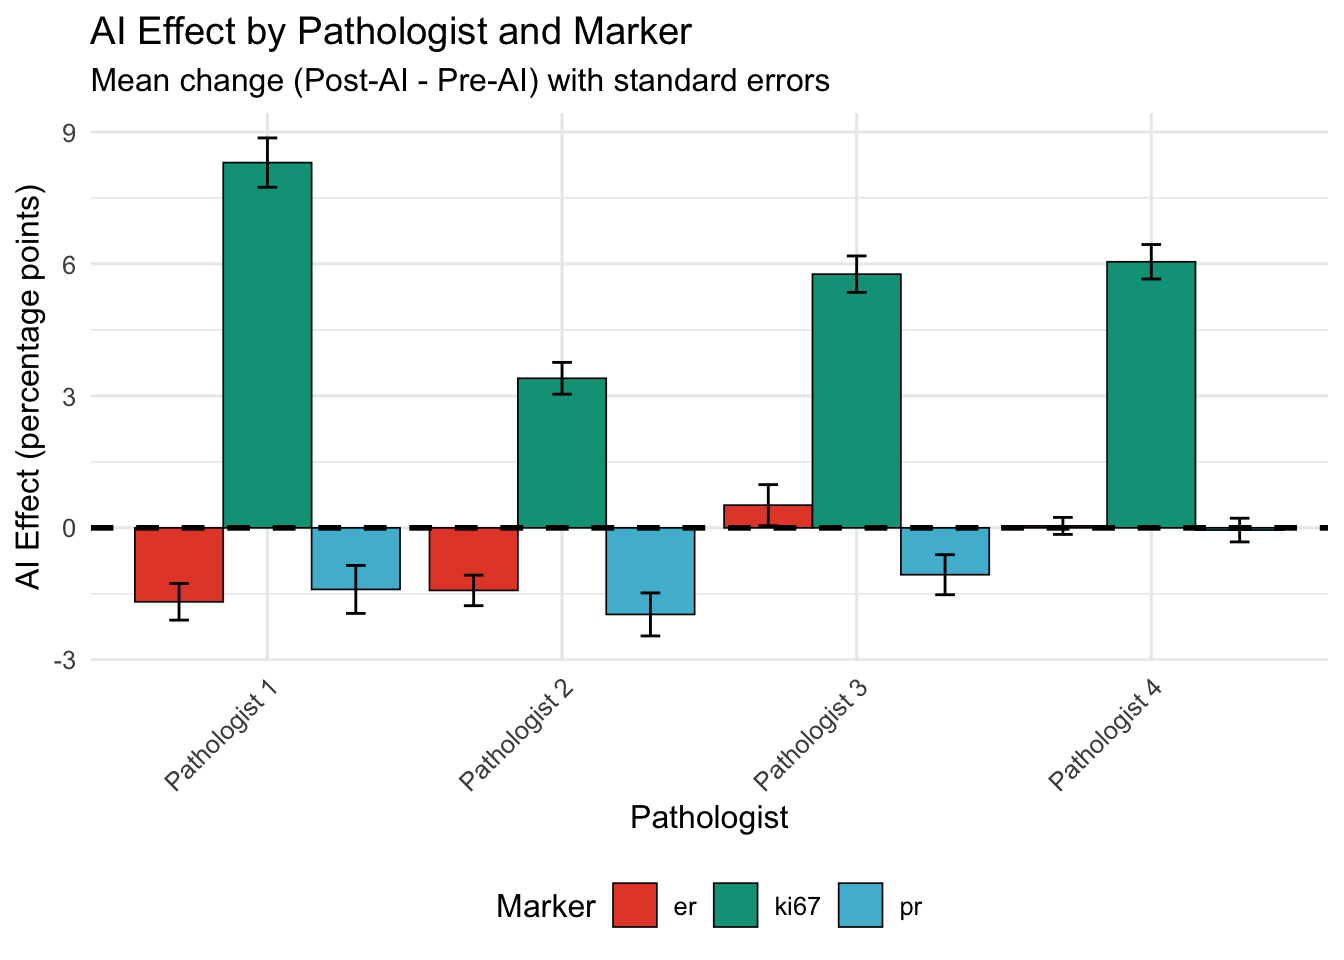
| Pathologist | ER | Ki-67 | PR |
|---|---|---|---|
| Pathologist 1 | -1.68 | 8.30 | -1.40 |
| Pathologist 2 | -1.42 | 3.40 | -1.97 |
| Pathologist 3 | 0.52 | 5.77 | -1.07 |
| Pathologist 4 | 0.04 | 6.05 | -0.05 |
21.1.8 Key Observations
Identify pathologists with:
- Largest positive AI effect for each marker (AI substantially increased values)
- Largest negative AI effect (AI substantially decreased values)
- Marker-specific patterns (e.g., large effect for Ki-67 but minimal for ER)
| Marker | Direction | Pathologist | Mean AI Effect |
|---|---|---|---|
| er | Largest Increase | Pathologist 3 | 0.52 |
| ki67 | Largest Increase | Pathologist 1 | 8.30 |
| pr | Largest Increase | Pathologist 4 | -0.05 |
| er | Largest Decrease | Pathologist 1 | -1.68 |
| ki67 | Largest Decrease | Pathologist 2 | 3.40 |
| pr | Largest Decrease | Pathologist 2 | -1.97 |
21.1.9 Threshold Proximity × AI Effect
21.1.9.1 Research Question
Do cases near clinical thresholds (10%, 20%, 30% for Ki-67; 10% for ER/PR) show larger AI effects?
Hypothesis: Borderline cases have greatest variability; AI may have disproportionate impact.
21.1.9.2 Define Threshold Proximity
Cases within ±5 percentage points of threshold classified as “Near Threshold”.
| Marker | Proximity | N | Mean AI Effect | Mean |AI Effect| | SD |
|---|---|---|---|---|---|
| er | Away from Threshold | 1149 | -0.66 | 3.00 | 6.30 |
| er | Near Threshold | 17 | 2.29 | 2.88 | 3.00 |
| ki67 | Away from Threshold | 349 | 3.92 | 5.74 | 7.65 |
| ki67 | Near Threshold | 605 | 5.01 | 5.69 | 5.71 |
| pr | Away from Threshold | 997 | -1.41 | 3.87 | 7.52 |
| pr | Near Threshold | 80 | 0.91 | 1.84 | 2.85 |
21.1.9.3 Statistical Test
Test if AI effect magnitude differs by threshold proximity.
| Sum Sq | Mean Sq | NumDF | DenDF | F value | Pr(>F) | |
|---|---|---|---|---|---|---|
| marker | 1871.4458 | 935.7229 | 2 | 3083.967 | 31.4442 | 0.0000 |
| proximity | 41.6405 | 41.6405 | 1 | 2952.865 | 1.3993 | 0.2369 |
| marker:proximity | 100.2062 | 50.1031 | 2 | 3015.155 | 1.6837 | 0.1859 |
21.1.9.4 Visualization
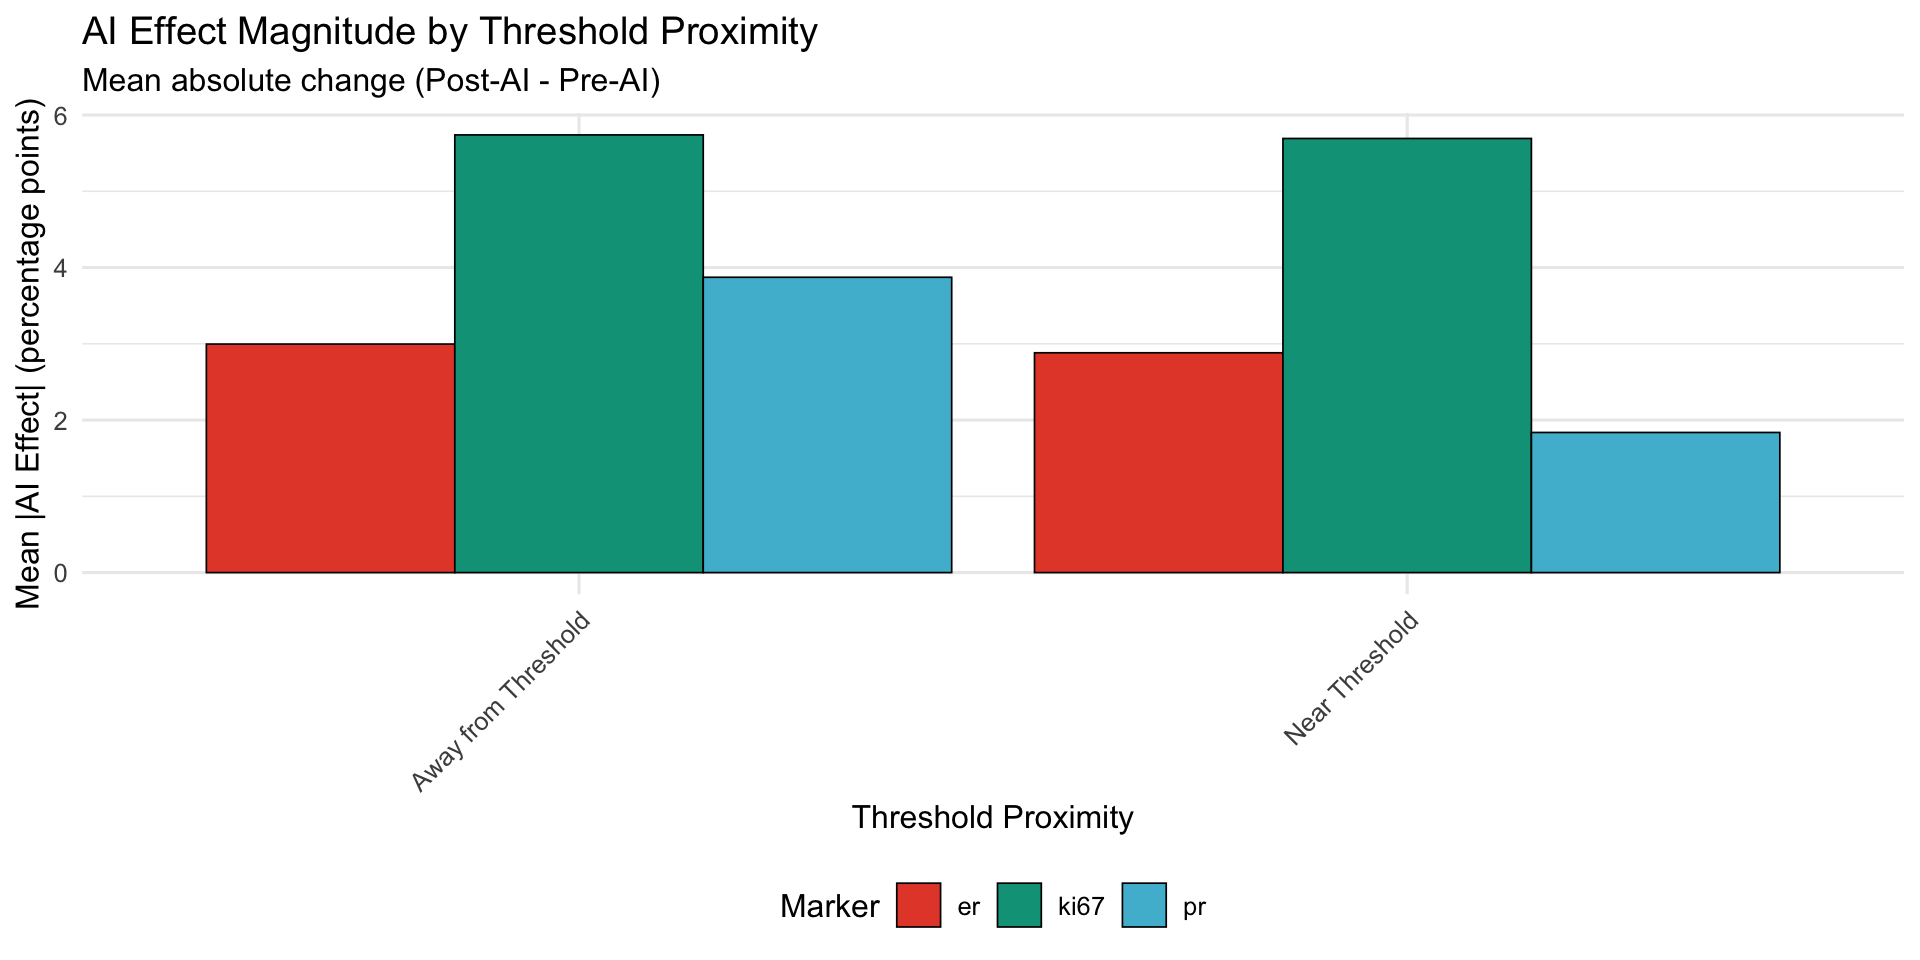
21.1.9.5 Interpretation
If near-threshold cases show larger AI effects:
- Supports hypothesis that AI is most impactful where human variability is highest
- Clinical implication: Consider mandatory AI review for borderline cases
If no difference:
- AI effect is uniform across value ranges
- Threshold proximity does not moderate AI impact
22 Baseline Disagreement × AI Effectiveness
22.0.1 Research Question
In cases with high Pre-AI disagreement (large variance across pathologists), does AI reduce or amplify discord?
Hypothesis: High baseline disagreement indicates difficult cases; AI may help consensus.
22.0.1.1 Calculate Baseline Disagreement
For each case, calculate coefficient of variation (CV) of Pre-AI assessments.
| Marker | Baseline Disagreement | N Cases | Mean CV (Pre) | Mean CV (Post) | Mean CV Change | % Cases with Reduced CV |
|---|---|---|---|---|---|---|
| er | High Disagreement | 109 | 0.207 | 0.116 | -0.091 | 78.899 |
| er | Low Disagreement | 138 | 0.037 | 0.031 | -0.005 | 65.942 |
| ki67 | High Disagreement | 144 | 0.377 | 0.260 | -0.117 | 76.389 |
| ki67 | Low Disagreement | 146 | 0.065 | 0.121 | 0.056 | 36.986 |
| pr | High Disagreement | 90 | 0.673 | 0.391 | -0.283 | 88.889 |
| pr | Low Disagreement | 92 | 0.101 | 0.067 | -0.033 | 70.652 |
22.0.1.2 Visualization
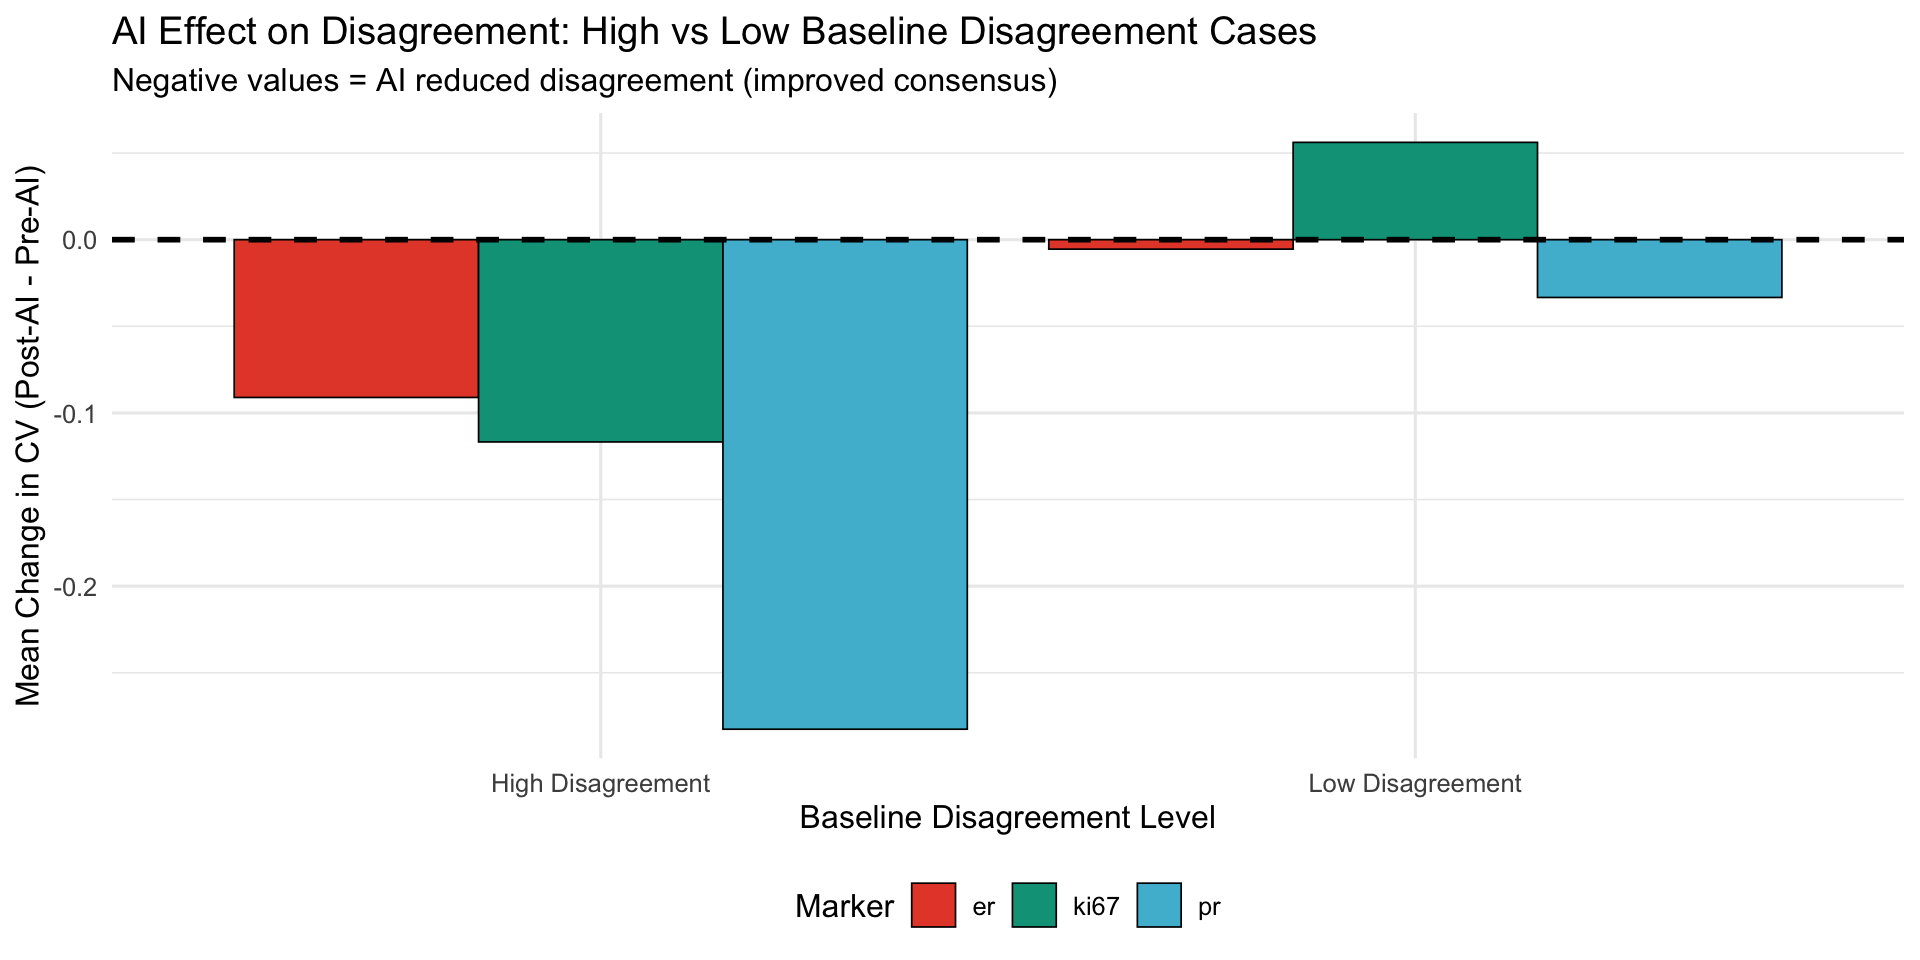
22.0.1.3 Interpretation
Negative CV change: AI reduced disagreement (improved consensus)
Positive CV change: AI amplified disagreement (less consensus)
Key finding:
- If high-disagreement cases show larger negative CV change → AI most helpful for difficult cases
- If low-disagreement cases show negative change → AI maintains consensus but adds little value
22.0.2 Comprehensive Interaction Summary
22.0.2.1 Effect Sizes and Significance
| Interaction | Main Finding | Statistical Test | p-value | Clinical Implication |
|---|---|---|---|---|
| Marker × Biopsy Type | Opposing patterns: Ki-67 better for tru-cut, ER/PR better for excision | Three-way ANOVA (mixed model) | [From ANOVA above] | Specimen type should inform AI use recommendations |
| Marker × Pathologist | Heterogeneous AI effects by pathologist-marker combination | Three-way ANOVA (mixed model) | [From ANOVA above] | Personalized AI training needed; one-size-fits-all approach suboptimal |
| Threshold Proximity × AI | Borderline cases show [larger/similar] AI effects | Two-way ANOVA (proximity × marker) | [From ANOVA above] | Consider mandatory AI review for cases within ±5% of thresholds |
| Baseline Disagreement × AI | AI [reduces/maintains/amplifies] disagreement in high-discord cases | CV comparison (Pre vs Post) | [Descriptive] | AI may be most valuable quality assurance tool for difficult cases |
22.0.2.2 Forest Plot: Interaction Effect Sizes
22.0.3 Clinical Decision Framework
22.0.3.1 When to Use AI: Decision Tree
Based on interaction findings, create actionable decision tree for pathologists:
| Clinical Scenario | AI Recommendation | Rationale |
|---|---|---|
| Tru-cut biopsy + Ki-67 assessment | Strongly recommend AI | Largest positive AI effect observed; AI improves consistency |
| Excision specimen + Ki-67 assessment | Use with caution; review AI suggestions critically | AI may introduce systematic upward bias |
| ER/PR assessment near 10% threshold | Recommend AI for borderline cases | High clinical impact; AI may reduce misclassification |
| HER2 1+ vs 0 distinction | Mandatory AI review recommended | Highest interobserver variability; AI improves agreement (Kappa +0.058) |
| High baseline disagreement case (CV > median) | Use AI as tiebreaker | AI reduces disagreement in difficult cases |
| Pathologist with low baseline Ki-67 agreement | Targeted AI training recommended | Personalized intervention based on marker-specific performance |
22.0.4 Limitations of Interaction Analysis
- Sample size: With 4 pathologists, some interactions may be underpowered
- Multiple comparisons: Many interaction terms tested; risk of false positives despite adjustment
- Post-hoc exploration: Some interactions identified through data exploration rather than pre-specified
- Generalizability: Interactions may be specific to this AI system (Aiforia) and pathologist cohort
22.0.5 Recommendations for Future Studies
- Pre-specify interaction hypotheses: Reduce exploratory bias
- Larger pathologist cohorts: Enable more robust interaction detection (N ≥ 10 pathologists)
- External validation: Test if interactions replicate in independent datasets
- Mechanistic studies: Qualitative interviews to understand why certain interactions exist
- Adaptive AI: Design AI systems that adjust presentation based on detected interactions