Total cases with paired Ki-67 data: 294 Mean Ki-67 change: 5.86 %Median Ki-67 change: 5 %Ki-67 proliferation index is a critical biomarker for breast cancer classification and treatment decisions, with clinical thresholds at:
- 10%: Distinguishing very low proliferation
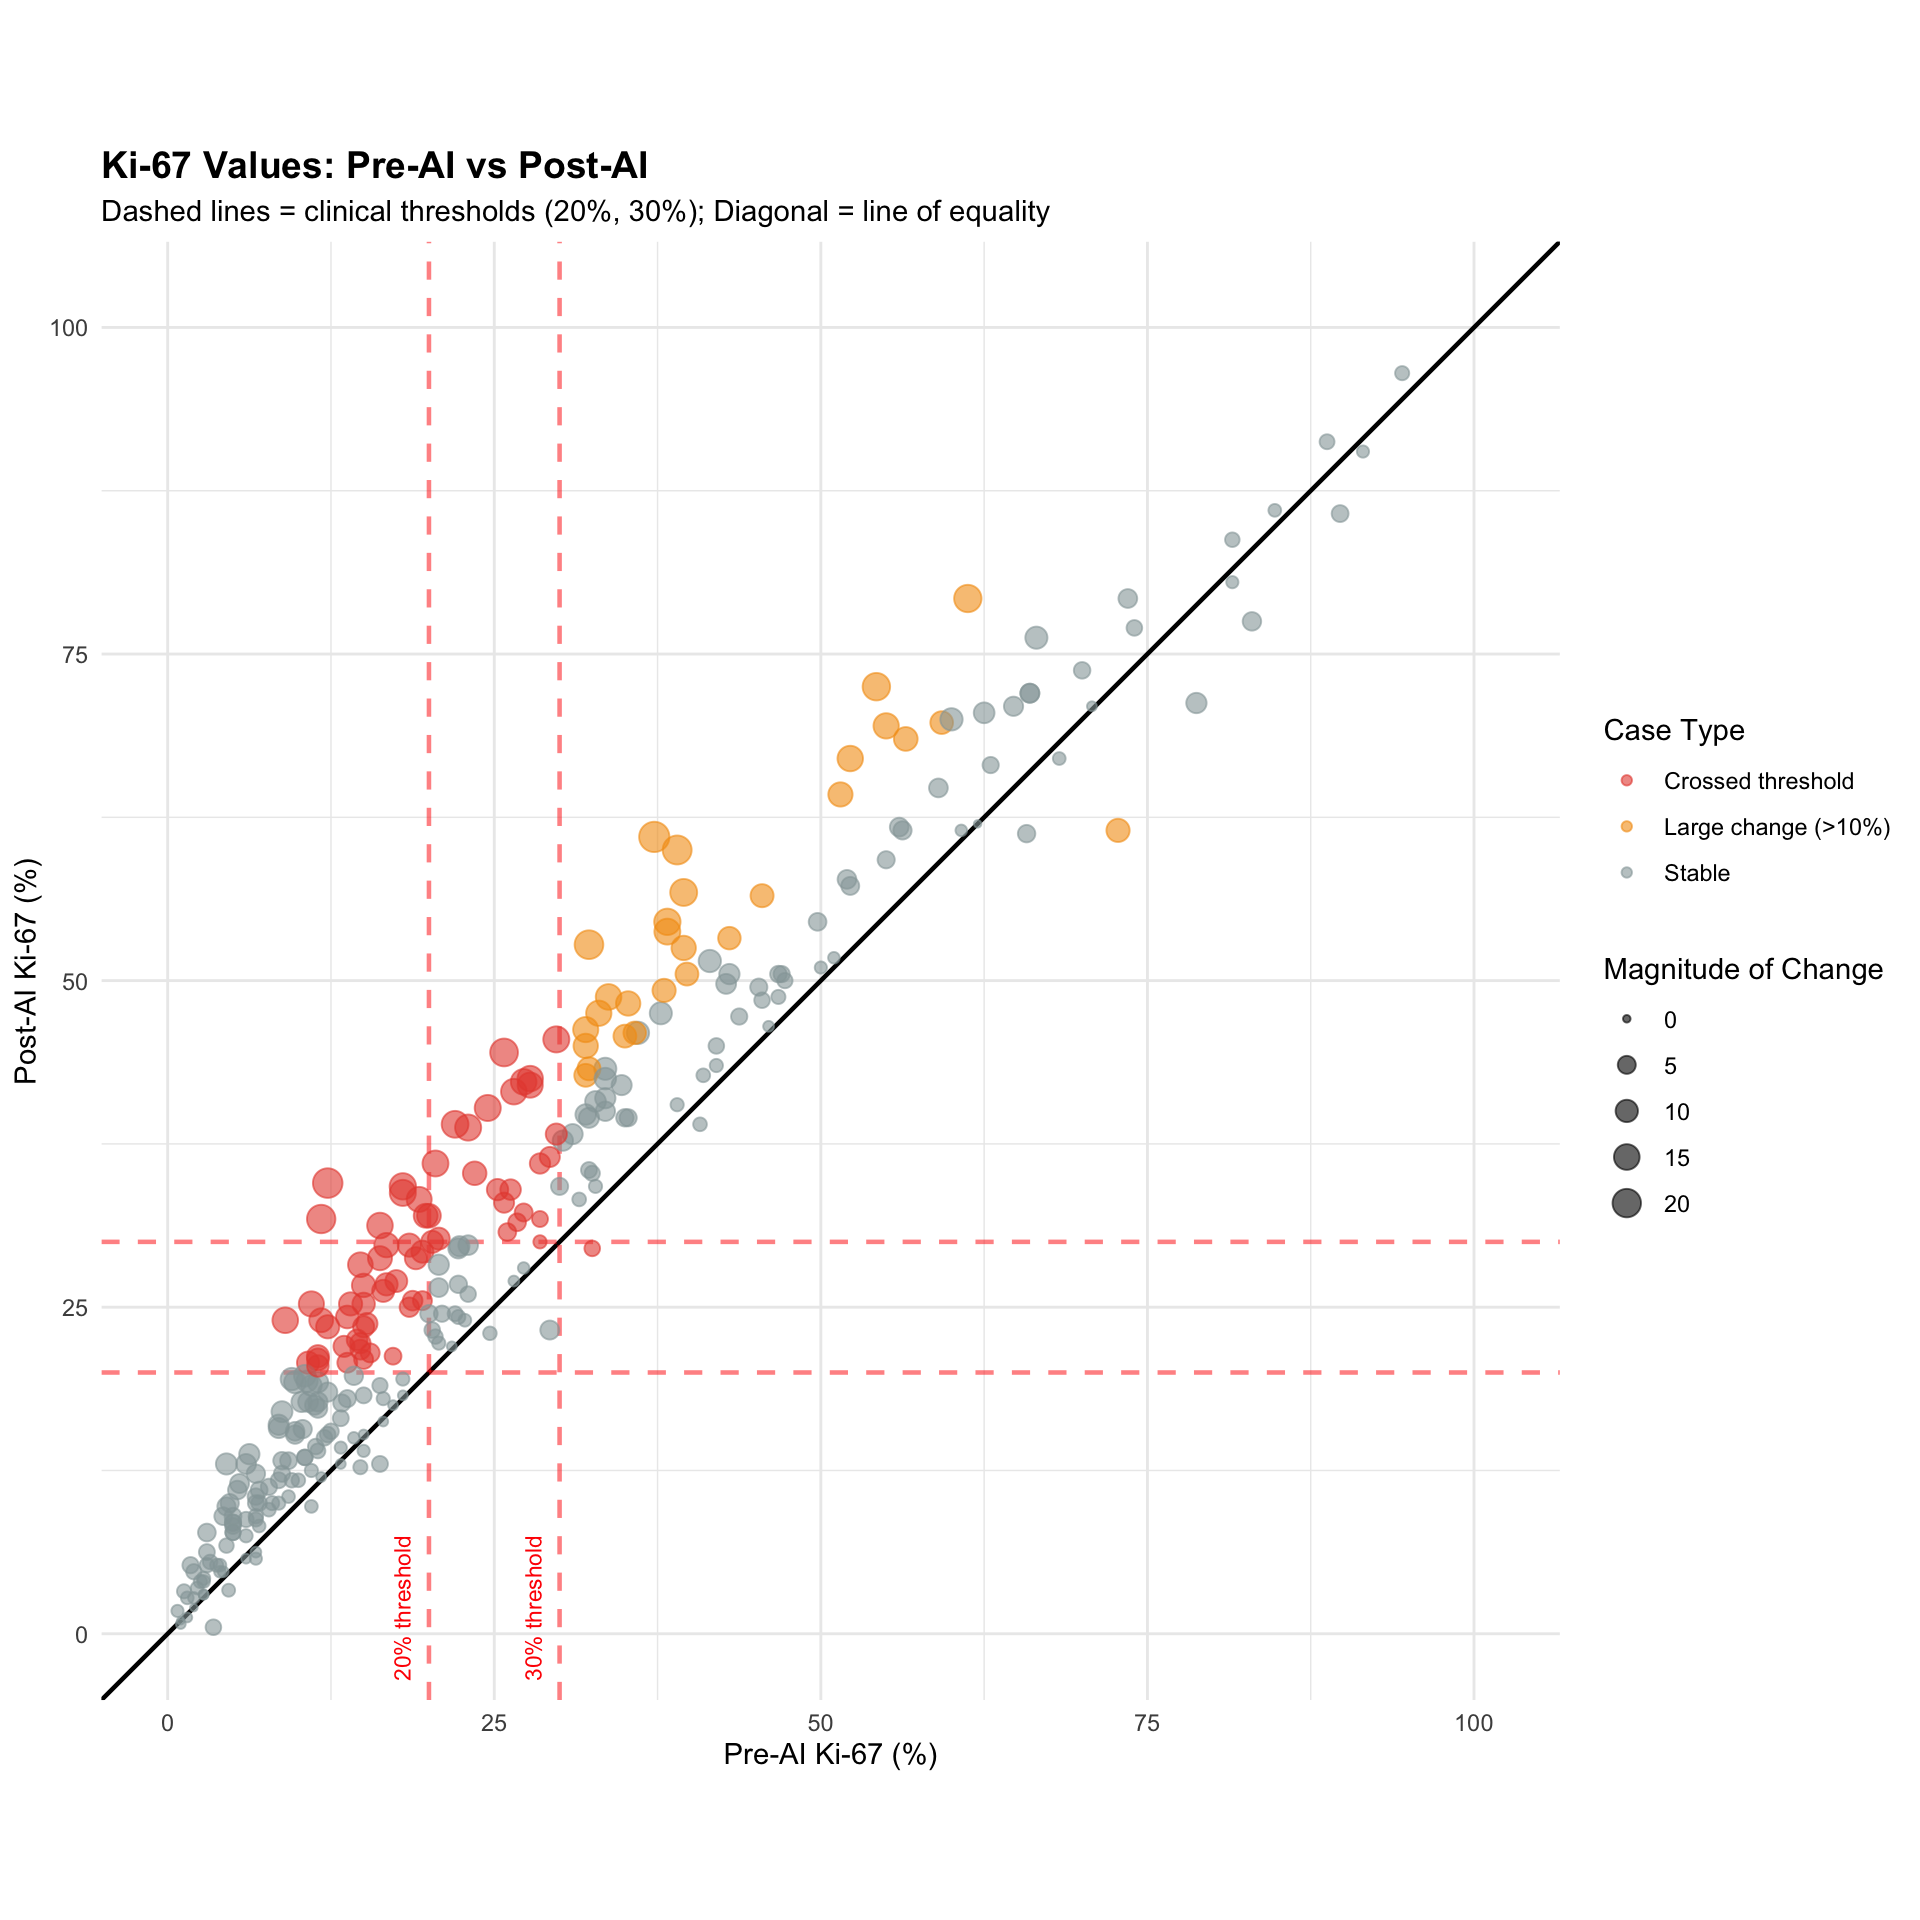
- 20%: Luminal A vs Luminal B boundary (primary clinical decision point)
- 30%: High proliferation cutoff (chemotherapy consideration)
Preliminary analysis shows AI systematically increases Ki-67 values by ~5.9% on average, with the largest impact in the 20-30% range. This analysis quantifies:
1. How many cases cross clinical thresholds due to AI?
2. What is the magnitude and direction of threshold crossings?
3. How does this affect molecular subtype classification?
4. What are the treatment implications?
Note for Pathologist: Ki67 is the most variable marker. We know AI tends to “count higher” than humans. The critical question is: Does this extra counting push patients over the 20% or 30% thresholds unnecessarily, leading to potential overtreatment (chemo)? Or does it correctly identify “hot spots” we missed?
Total cases with paired Ki-67 data: 294 Mean Ki-67 change: 5.86 %Median Ki-67 change: 5 %Define clinical thresholds and identify cases that cross them.
| Ki-67 Threshold Crossing Analysis | |||
| Cases crossing clinical thresholds due to AI assistance | |||
| Threshold (%) | Crossing Direction | N Cases | Proportion |
|---|---|---|---|
| 10 | Downward (Pre≥Thresh → Post<Thresh) | 1 | 0.3% |
| 10 | Upward (Pre<Thresh → Post≥Thresh) | 28 | 9.5% |
| 20 | Upward (Pre<Thresh → Post≥Thresh) | 41 | 13.9% |
| 30 | Downward (Pre≥Thresh → Post<Thresh) | 1 | 0.3% |
| 30 | Upward (Pre<Thresh → Post≥Thresh) | 32 | 10.9% |
Note for Pathologist: The threshold crossing table tells you how many cases moved across the critical Ki67 cutoffs (10%, 20%, 30%) due to AI. “Upward” crossing means the value went from below the cutoff to at or above it. This is clinically important because crossing the 20% or 30% threshold can change a patient’s molecular subtype classification and, consequently, their treatment plan.
| Threshold Crossing Patterns by Ki-67 Threshold | |||||
| Movement patterns relative to clinical cutoffs | |||||
| Threshold (%) | Crossing Pattern | N Cases | Mean Δ Ki-67 (%) | Median Δ Ki-67 (%) | Mean Crossing Magnitude (%) |
|---|---|---|---|---|---|
| 10 | Stable Above | 221 | 6.78 | 6.50 | — |
| 10 | Stable Below | 44 | 1.61 | 1.50 | — |
| 10 | Below → Above (Upward) | 28 | 5.50 | 5.38 | 5.50 |
| 10 | Above → Below (Downward) | 1 | −1.25 | −1.25 | 1.25 |
| 20 | Stable Above | 142 | 6.69 | 6.00 | — |
| 20 | Stable Below | 111 | 2.99 | 2.75 | — |
| 20 | Below → Above (Upward) | 41 | 10.72 | 10.00 | 10.72 |
| 30 | Stable Below | 165 | 4.32 | 3.50 | — |
| 30 | Stable Above | 96 | 6.57 | 5.88 | — |
| 30 | Below → Above (Upward) | 32 | 11.95 | 13.12 | 11.95 |
| 30 | Above → Below (Downward) | 1 | −3.00 | −3.00 | 3.00 |
Waterfall plot showing all cases and highlighting threshold crossers.
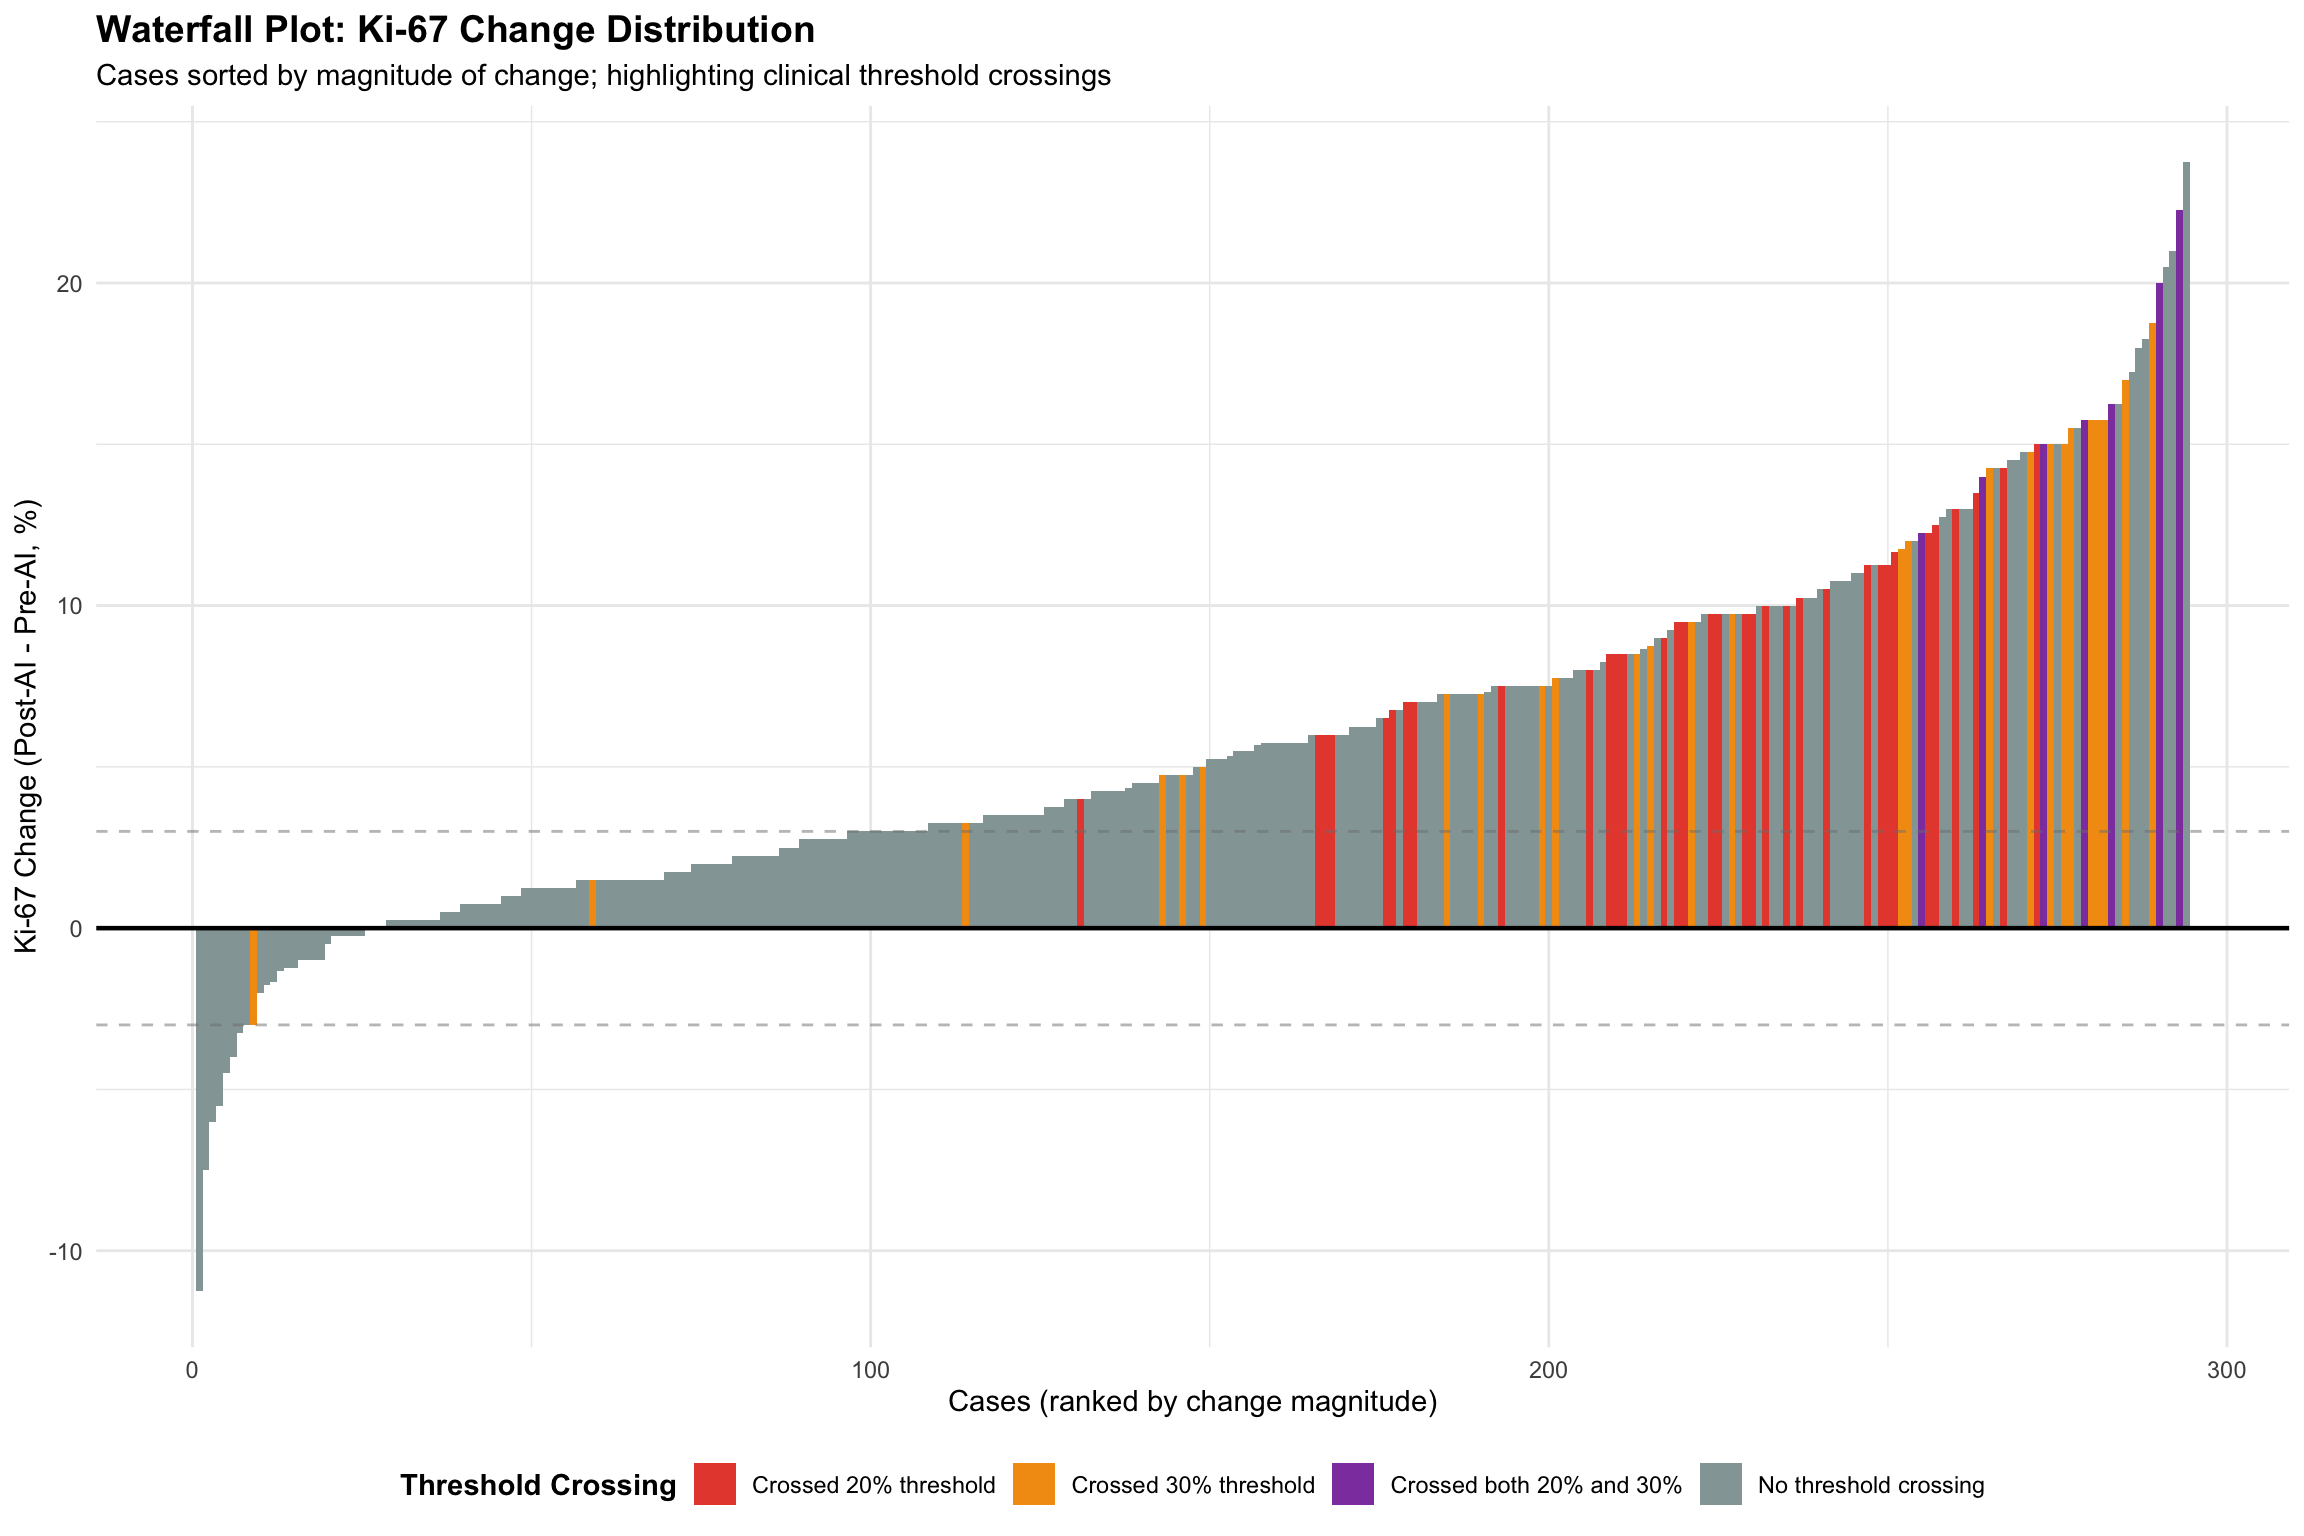
Threshold Crossing Summary:Cases crossing 20% threshold: 41 Cases crossing 30% threshold: 33 Cases crossing both: 7 Total cases crossing any threshold: 67 Note for Pathologist: The waterfall plot sorts every case by the amount Ki67 changed. Cases highlighted in red or orange crossed a clinical threshold. If the plot is heavily right-shifted (more positive changes), AI systematically increases Ki67. The threshold-crossing cases are the ones most likely to have their treatment plan altered.
Analyze whether AI bias varies by Ki-67 range (Bland-Altman by range).
| Ki-67 Bias by Pre-AI Range | |||||||
| Does AI systematically shift values more in certain ranges? | |||||||
| Ki-67 Range | N Cases | Mean Pre (%) | Mean Post (%) | Mean Bias (%) | SD Bias | Median Bias (%) | IQR Bias |
|---|---|---|---|---|---|---|---|
| Very Low (<10%) | 72 | 5.39 | 8.51 | 3.12 | 2.98 | 2.75 | 3.31 |
| Low (10-20%) | 80 | 14.18 | 21.02 | 6.84 | 5.12 | 6.88 | 6.81 |
| Moderate (20-30%) [Critical]1 | 45 | 24.32 | 31.50 | 7.18 | 5.77 | 7.25 | 8.75 |
| High (30-50%) | 57 | 37.61 | 45.65 | 8.04 | 5.72 | 7.50 | 7.50 |
| Very High (≥50%) | 40 | 66.55 | 70.78 | 4.23 | 6.54 | 4.00 | 6.06 |
| 1 Critical range: Luminal A/B boundary (20%) and high proliferation cutoff (30%) | |||||||
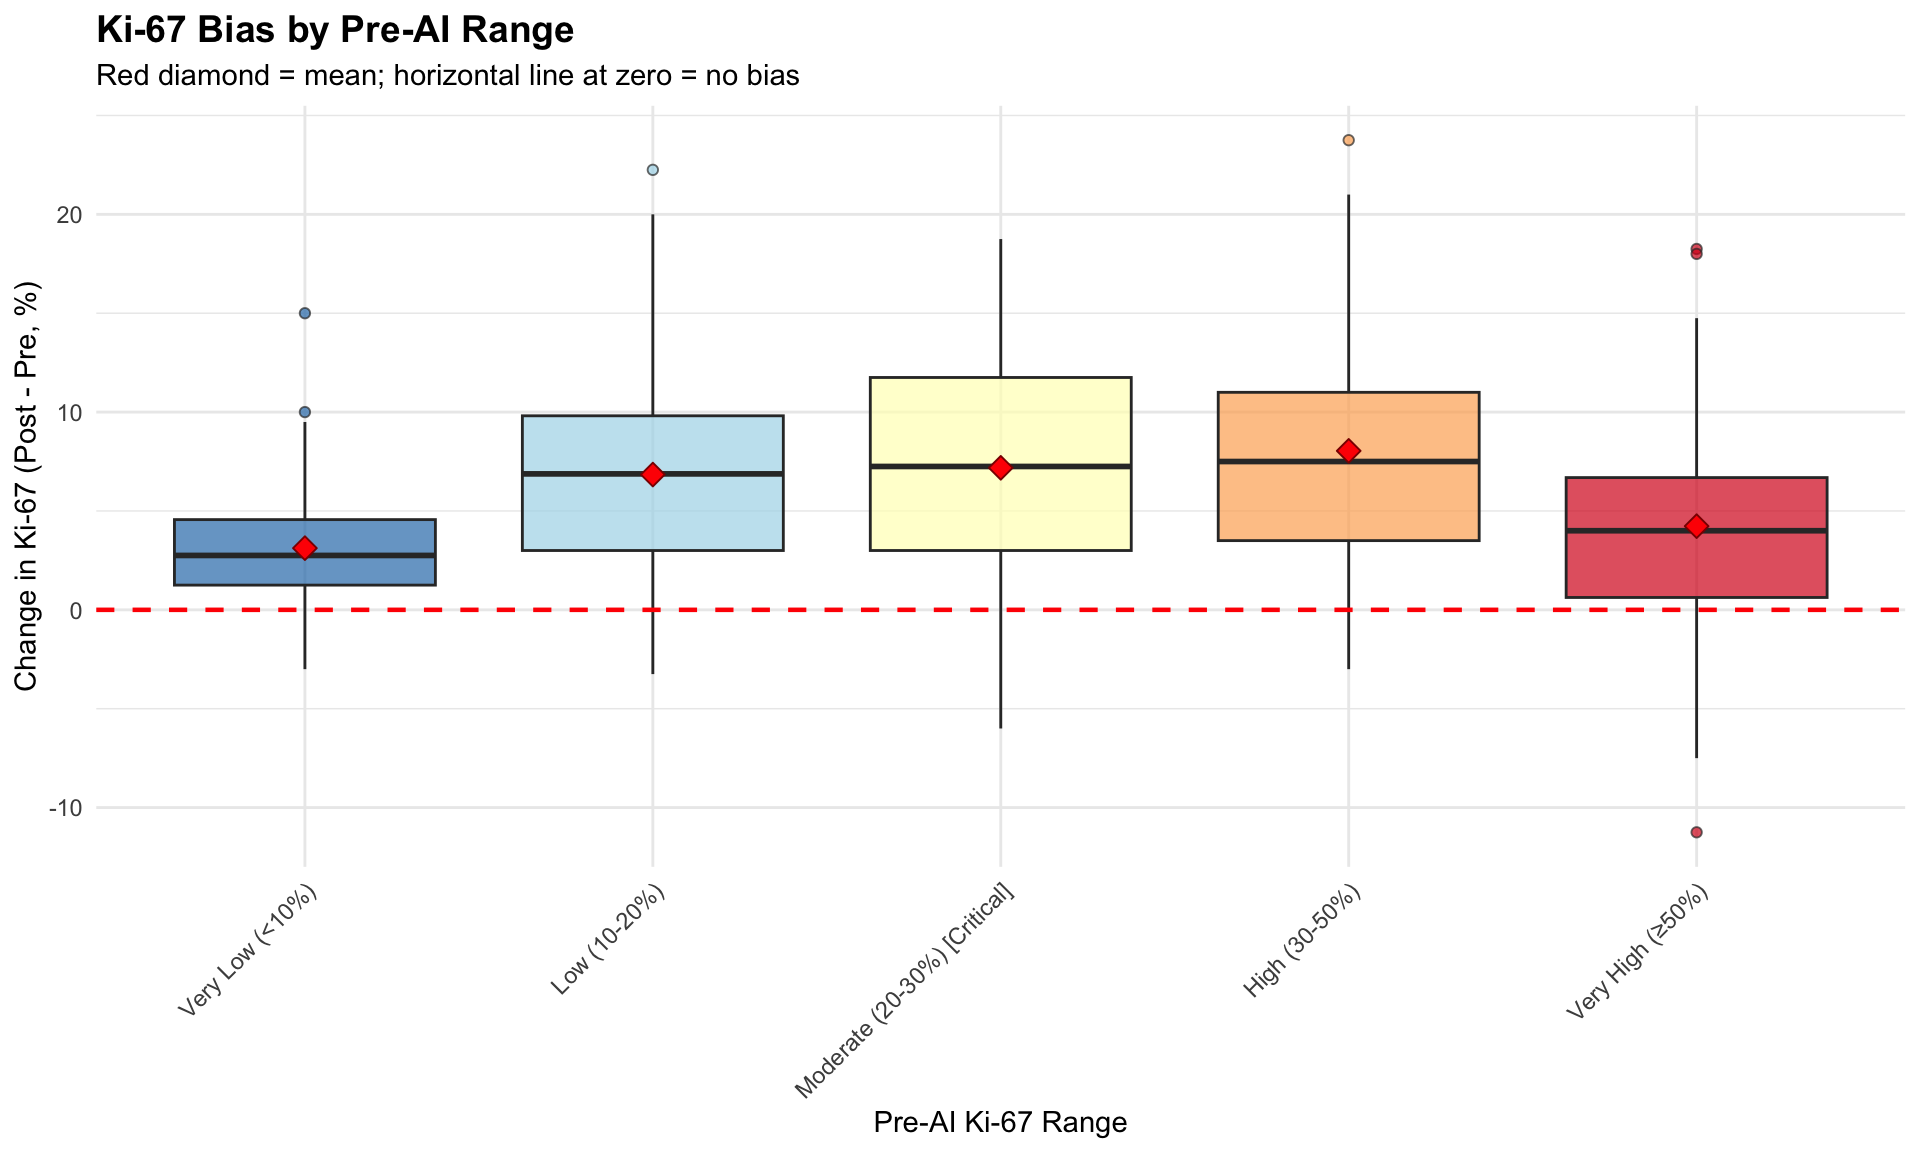
Statistical Test: Is bias proportional to Ki-67 level?Correlation (Pre Ki-67 vs Change): 0.004 P-value: 0.948 → No significant proportional biasPassing-Bablok regression is a non-parametric method for detecting proportional and constant bias.
Do cases near thresholds have higher disagreement?
| Agreement and Bias by Threshold Proximity | ||||||
| Do cases near clinical thresholds show different patterns? | ||||||
| Proximity to Threshold | N Cases | Mean Pre-AI SD (%) | Mean Post-AI SD (%) | Mean Δ Ki-67 (%) | SD of Change | Δ Disagreement (Post-Pre)1 |
|---|---|---|---|---|---|---|
| Away from thresholds | 191 | 3.53 | 4.06 | 5.02 | 5.30 | 0.53 |
| Borderline 20% (15-25%) | 58 | 3.74 | 3.78 | 7.01 | 5.34 | 0.04 |
| Borderline 30% (25-35%) | 45 | 4.67 | 5.02 | 7.94 | 5.61 | 0.35 |
| 1 Negative change = AI reduces disagreement; Positive = AI increases disagreement | ||||||
What if the Luminal A/B cutoff were 25% instead of 30%?
Sensitivity Analysis: Alternative Threshold at 25%| Reclassification with Alternative 25% Threshold | ||
| Comparison: Standard 30% vs Alternative 25% cutoff | ||
| Reclassification Pattern | N Cases | Proportion |
|---|---|---|
| Luminal A → Luminal B | 38 | 12.9% |
| Luminal B → Luminal A | 1 | 0.3% |
| No change | 255 | 86.7% |
Comparison:Reclassified cases with 30% threshold: 33 Reclassified cases with 25% threshold: 39 Difference: 6 Link Ki-67 threshold crossings to molecular subtype changes.
| Molecular Subtype Changes by Ki-67 Threshold Crossing | ||||
| Association between threshold crossing and subtype reclassification | ||||
| Threshold Crossing | Subtype Stable | Subtype Changed | Total | % Changed |
|---|---|---|---|---|
| No crossing | 805 | 81 | 886 | 9.1 |
| Crossed 30% only | 29 | 80 | 109 | 73.4 |
| Crossed 20% only | 113 | 6 | 119 | 5.0 |
| Crossed both | 15 | 33 | 48 | 68.8 |
Visualize the clinical pathway from Ki-67 value to treatment decision.
Clinical Decision Tree: Ki-67 → Molecular Subtype → TreatmentStep 1: Ki-67 Assessment ├─ Ki-67 < 20%: │ ├─ If ER+ PR+ HER2-: Luminal A │ │ └─ Treatment: Endocrine therapy alone │ └─ If ER+ PR- HER2-: Luminal A (weak PR) │ └─ Treatment: Endocrine therapy ± chemotherapy (consider PR status) │ └─ Ki-67 ≥ 20% (or ≥ 30% in some guidelines): ├─ If ER+ HER2-: Luminal B │ └─ Treatment: Endocrine therapy + chemotherapy └─ Higher proliferation suggests more aggressive diseaseImpact of AI-Induced Ki-67 Increase:| Treatment Decision Impact of AI-Induced Ki-67 Changes | ||
| Assuming ER+ HER2- disease and 20% Ki-67 threshold | ||
| Treatment Decision Change | N Cases | % of Cases |
|---|---|---|
| Endocrine only → Endocrine + Chemo | 41 | 13.9 |
| No treatment change | 253 | 86.1 |
Key Clinical Implication:→ AI predominantly causes treatment ESCALATION (adding chemotherapy)
Risk: Potential overtreatment if AI systematically overestimates Ki-67Visual representation of individual case movements across thresholds.
===== KI-67 THRESHOLD ANALYSIS SUMMARY =====1. SYSTEMATIC BIAS: Mean Ki-67 increase: 5.86 % Median Ki-67 increase: 5 % → AI systematically INCREASES Ki-67 estimates2. THRESHOLD CROSSINGS: Cases crossing 20% threshold: 41 ( 13.9 %) Cases crossing 30% threshold: 33 ( 11.2 %)3. RANGE-SPECIFIC EFFECTS: Mean bias in 20-30% range: 7.18 %
→ Highest impact in Luminal A/B boundary zone4. CLINICAL IMPLICATIONS: a) Molecular subtype classification: - Luminal A vs B distinction may be affected - Consider Ki-67 trend in context of other markers b) Treatment decisions: - Potential chemotherapy escalation in borderline cases - Exercise caution near 20% and 30% cutoffs c) Quality assurance: - Regular calibration checks for AI-assisted Ki-67 - Human oversight especially for threshold-proximate cases5. RECOMMENDATIONS: ✓ Use AI as decision support, not replacement ✓ Review all cases within ±5% of clinical thresholds manually ✓ Consider percentage point ranges (e.g., 18-22%) instead of hard cutoffs ✓ Integrate clinical context (tumor grade, stage, patient factors) ✓ Monitor AI performance with periodic consensus reviews ✓ Document when AI recommendations are overridden and reasonsThis comprehensive threshold analysis reveals that AI-assisted Ki-67 assessment systematically increases proliferation estimates, with the greatest impact in the clinically critical 20-30% range (Luminal A/B boundary). While this improves interobserver agreement, it has significant implications for:
The systematic upward bias suggests AI algorithms may be calibrated to favor sensitivity over specificity in detecting high proliferation, or may reflect training data characteristics. Clinicians should exercise particular caution when AI-derived Ki-67 values fall within ±5% of the 20% and 30% thresholds, considering integrating additional clinical and pathologic features before making treatment decisions.