[1] "Filtered to common cohort. Merged N: 1184"5 Inter-observer Agreement Analysis
5.1 Objective
Assess the inter-observer agreement between pathologists before and after using AI assistance.
Note for Pathologist: This file analyzes how much pathologists agree with each other (Inter-Observer Agreement). We use statistical metrics like ICC (for numerical values like Ki67%) and Kappa (for categories like HER2 Score). Higher values mean better agreement. We compare these metrics between the “Pre-AI” and “Post-AI” phases to see if the AI tool helped harmonize your assessments.
5.2 Setup
5.3 Load Data
5.4 Methods
- Continuous Variables (ER, PR, Ki67): Intraclass Correlation Coefficient (ICC). Two-way random effects model, absolute agreement, single rater/average (depending on clinical use, usually single rater for individual reliability).
- Categorical Variables (HER2): Fleiss’ Kappa.
- Molecular Subtypes: Fleiss’ Kappa.
- HER2 Positive: HER2 Score 2 or 3.
- Luminal A: HER2 (0/1) & ER >= 10% & PR >= 10% & Ki67 < 30%.
- Luminal B: HER2 (0/1) & ER >= 10% & Ki67 >= 30%.
- Hormone Weak Positive: HER2 (0/1) & (ER > 0 OR PR > 0) & Not Luminal A/B.
- Triple Negative: HER2 (0/1) & ER = 0 & PR = 0.
- HER2 Positive: HER2 Score 2 or 3.
5.5 Analysis Function
5.6 Results
ICC model specification: We use ICC(2,1) — two-way random effects, absolute agreement, single measures — which assesses the reliability of a single pathologist’s rating. This is appropriate because clinical decisions are based on individual pathologist assessments, not the average of multiple pathologists (which would use ICC(2,k)). For HER2, Fleiss’ Kappa treats categories as nominal; the supplementary weighted Kappa analysis with quadratic weights (Section 7) accounts for HER2’s ordinal structure and should be considered the primary HER2 agreement metric.
5.6.1 Pre-AI Agreement
[1] "Marker: er Type: continuous"
[1] 295   4
[1] "Marker: pr Type: continuous"
[1] 293 4[1] "Marker: ki67 Type: continuous"
[1] 291 4[1] "Marker: her2 Type: categorical"
[1] 229 4[1] "Marker: molecular_subtype Type: categorical"
[1] 296 45.6.2 Post-AI Agreement
[1] "Marker: er Type: continuous"
[1] 287   4
[1] "Marker: pr Type: continuous"
[1] 278 4[1] "Marker: ki67 Type: continuous"
[1] 282 4[1] "Marker: her2 Type: categorical"
[1] 226 4[1] "Marker: molecular_subtype Type: categorical"
[1] 296 45.7 Detailed Descriptive Statistics
5.7.1 Summary Tables by Pathologist
| Descriptive Statistics: ER | ||||||
| Modality | Mean | Median | SD | Min | Max | N |
|---|---|---|---|---|---|---|
| Pathologist 1 | ||||||
| Pre-AI | 72.93 | 95.00 | 37.23 | 0 | 100 | 296 |
| Post-AI | 71.63 | 91.00 | 36.85 | 0 | 100 | 296 |
| Pathologist 2 | ||||||
| Pre-AI | 73.96 | 95.00 | 38.10 | 0 | 100 | 296 |
| Post-AI | 72.48 | 93.00 | 37.81 | 0 | 100 | 296 |
| Pathologist 3 | ||||||
| Pre-AI | 67.49 | 90.00 | 34.78 | 0 | 95 | 296 |
| Post-AI | 68.11 | 90.00 | 35.03 | 0 | 95 | 296 |
| Pathologist 4 | ||||||
| Pre-AI | 71.90 | 95.00 | 37.46 | 0 | 95 | 296 |
| Post-AI | 71.95 | 95.00 | 37.10 | 0 | 98 | 296 |
| Descriptive Statistics: PR | ||||||
| Modality | Mean | Median | SD | Min | Max | N |
|---|---|---|---|---|---|---|
| Pathologist 1 | ||||||
| Pre-AI | 31.72 | 7.50 | 37.53 | 0 | 100 | 296 |
| Post-AI | 30.74 | 11.00 | 34.96 | 0 | 100 | 296 |
| Pathologist 2 | ||||||
| Pre-AI | 32.75 | 10.00 | 37.29 | 0 | 100 | 296 |
| Post-AI | 30.99 | 10.00 | 35.68 | 0 | 100 | 296 |
| Pathologist 3 | ||||||
| Pre-AI | 30.41 | 10.00 | 34.58 | 0 | 95 | 296 |
| Post-AI | 29.52 | 10.00 | 33.57 | 0 | 95 | 296 |
| Pathologist 4 | ||||||
| Pre-AI | 30.89 | 5.00 | 36.97 | 0 | 95 | 296 |
| Post-AI | 30.84 | 6.00 | 36.34 | 0 | 95 | 296 |
| Descriptive Statistics: Ki67 | ||||||
| Modality | Mean | Median | SD | Min | Max | N |
|---|---|---|---|---|---|---|
| Pathologist 1 | ||||||
| Pre-AI | 23.77 | 17.00 | 20.73 | 1 | 96 | 296 |
| Post-AI | 32.19 | 28.00 | 21.94 | 0 | 97 | 296 |
| Pathologist 2 | ||||||
| Pre-AI | 28.00 | 22.00 | 21.60 | 0 | 96 | 296 |
| Post-AI | 31.65 | 27.00 | 21.95 | 0 | 97 | 296 |
| Pathologist 3 | ||||||
| Pre-AI | 23.59 | 18.00 | 20.23 | 1 | 90 | 296 |
| Post-AI | 29.53 | 25.00 | 20.83 | 0 | 95 | 296 |
| Pathologist 4 | ||||||
| Pre-AI | 25.81 | 20.00 | 21.42 | 0 | 96 | 296 |
| Post-AI | 31.90 | 27.00 | 22.67 | 0 | 97 | 296 |
| Distribution: HER2 | ||||
| Modality | 0 | 1 | 2 | 3 |
|---|---|---|---|---|
| Pathologist 1 | ||||
| Pre-AI | 90 | 115 | 43 | 34 |
| Post-AI | 73 | 135 | 39 | 34 |
| Pathologist 2 | ||||
| Pre-AI | 65 | 148 | 50 | 33 |
| Post-AI | 67 | 155 | 36 | 32 |
| Pathologist 3 | ||||
| Pre-AI | 125 | 57 | 48 | 33 |
| Post-AI | 120 | 72 | 38 | 33 |
| Pathologist 4 | ||||
| Pre-AI | 65 | 118 | 51 | 32 |
| Post-AI | 57 | 131 | 47 | 33 |
| Distribution: Molecular Subtype | |||||
| Modality | HER2 Positive | Hormone Weak Positive | Luminal A | Luminal B | Triple Negative |
|---|---|---|---|---|---|
| Pathologist 1 | |||||
| Pre-AI | 77 | 52 | 102 | 32 | 33 |
| Post-AI | 73 | 44 | 77 | 69 | 33 |
| Pathologist 2 | |||||
| Pre-AI | 83 | 43 | 93 | 45 | 32 |
| Post-AI | 68 | 48 | 77 | 68 | 35 |
| Pathologist 3 | |||||
| Pre-AI | 81 | 40 | 104 | 36 | 35 |
| Post-AI | 71 | 38 | 83 | 66 | 38 |
| Pathologist 4 | |||||
| Pre-AI | 83 | 54 | 91 | 33 | 35 |
| Post-AI | 80 | 43 | 73 | 65 | 35 |
5.7.2 Crosstables (Pathologist vs Marker)
| Crosstable: ER | |||
| Modality | Negative | Low | Positive |
|---|---|---|---|
| Pathologist 1 | |||
| Pre-AI | 48 | 8 | 240 |
| Post-AI | 44 | 8 | 240 |
| Pathologist 2 | |||
| Pre-AI | 49 | 4 | 242 |
| Post-AI | 46 | 9 | 239 |
| Pathologist 3 | |||
| Pre-AI | 50 | 5 | 241 |
| Post-AI | 46 | 7 | 240 |
| Pathologist 4 | |||
| Pre-AI | 49 | 6 | 241 |
| Post-AI | 49 | 4 | 243 |
| Crosstable: PR | |||
| Modality | Negative | Low | Positive |
|---|---|---|---|
| Pathologist 1 | |||
| Pre-AI | 113 | 34 | 147 |
| Post-AI | 102 | 39 | 150 |
| Pathologist 2 | |||
| Pre-AI | 109 | 32 | 154 |
| Post-AI | 106 | 32 | 146 |
| Pathologist 3 | |||
| Pre-AI | 123 | 16 | 156 |
| Post-AI | 105 | 29 | 156 |
| Pathologist 4 | |||
| Pre-AI | 117 | 36 | 142 |
| Post-AI | 113 | 35 | 147 |
| Crosstable: Molecular Subtype | |||||
| Modality | HER2 Positive | Hormone Weak Positive | Luminal A | Luminal B | Triple Negative |
|---|---|---|---|---|---|
| Pathologist 1 | |||||
| Pre-AI | 77 | 52 | 102 | 32 | 33 |
| Post-AI | 73 | 44 | 77 | 69 | 33 |
| Pathologist 2 | |||||
| Pre-AI | 83 | 43 | 93 | 45 | 32 |
| Post-AI | 68 | 48 | 77 | 68 | 35 |
| Pathologist 3 | |||||
| Pre-AI | 81 | 40 | 104 | 36 | 35 |
| Post-AI | 71 | 38 | 83 | 66 | 38 |
| Pathologist 4 | |||||
| Pre-AI | 83 | 54 | 91 | 33 | 35 |
| Post-AI | 80 | 43 | 73 | 65 | 35 |
5.7.3 Comparison
| Inter-Observer Agreement: Pre-AI vs Post-AI | ||||||
| Marker | Modality | metric | value | lower | upper | P (Pre vs Post)1 |
|---|---|---|---|---|---|---|
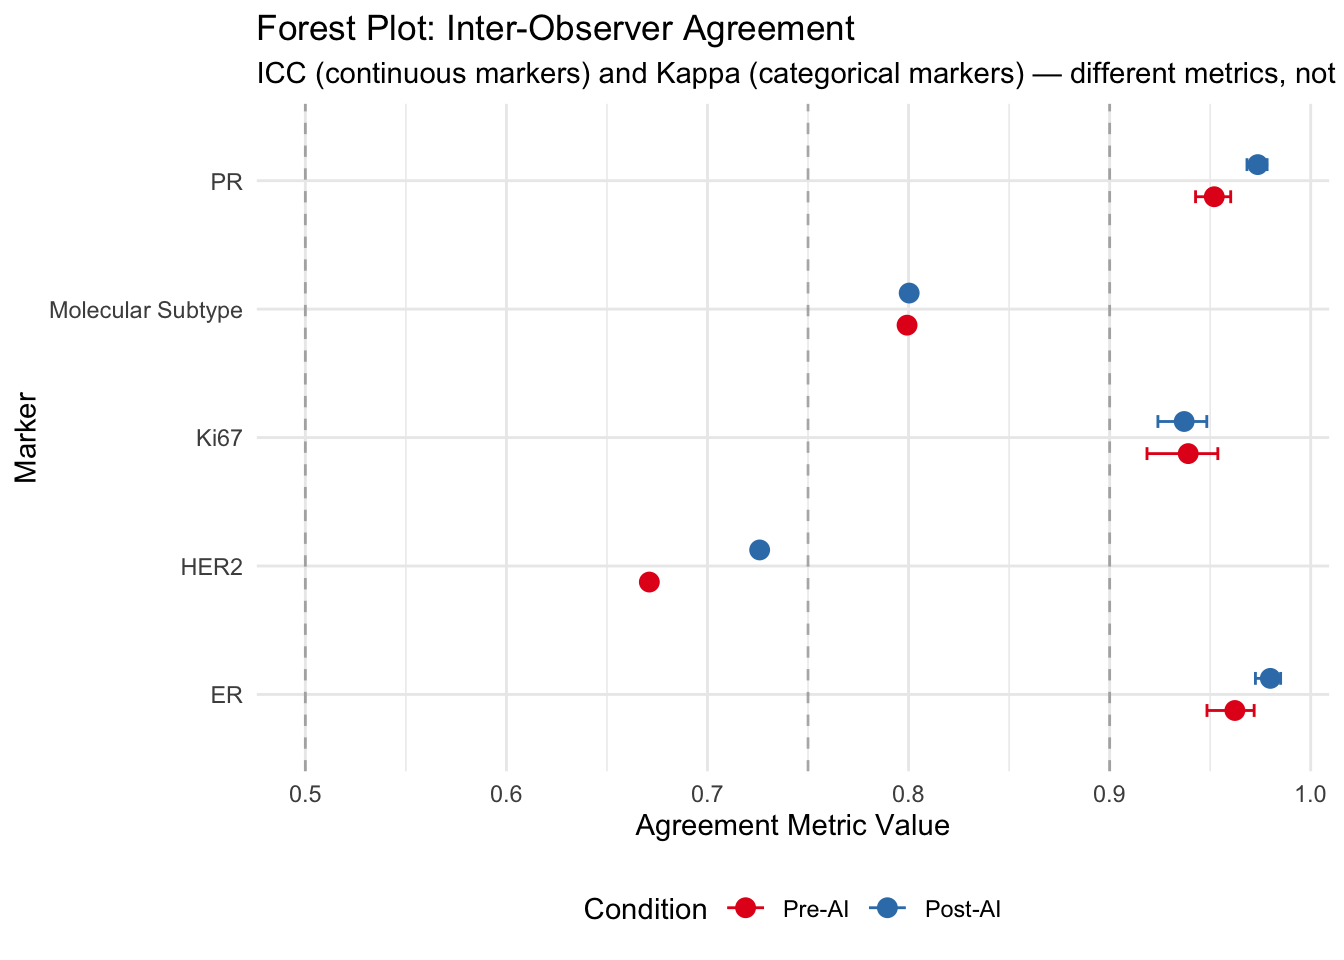
| ER | Pre-AI | ICC | 0.962 | 0.948 | 0.972 | NA |
| ER | Post-AI | ICC | 0.980 | 0.973 | 0.985 | 0.009 |
| PR | Pre-AI | ICC | 0.952 | 0.943 | 0.960 | NA |
| PR | Post-AI | ICC | 0.974 | 0.968 | 0.978 | 0.000 |
| Ki67 | Pre-AI | ICC | 0.939 | 0.919 | 0.954 | NA |
| Ki67 | Post-AI | ICC | 0.937 | 0.924 | 0.948 | 0.854 |
| HER2 | Pre-AI | Fleiss Kappa | 0.671 | NA | NA | NA |
| HER2 | Post-AI | Fleiss Kappa | 0.726 | NA | NA | 0.004 |
| Molecular Subtype | Pre-AI | Fleiss Kappa | 0.799 | NA | NA | NA |
| Molecular Subtype | Post-AI | Fleiss Kappa | 0.800 | NA | NA | 0.458 |
| 1 ICC: z-test on Fisher-transformed values (approximate). Kappa: bootstrap test (2000 resamples). Both test H₀: no difference between Pre-AI and Post-AI agreement. | ||||||
5.8 Conclusion
5.8.1 Interpretation Guidelines
- ICC (Intraclass Correlation Coefficient):
- < 0.5: Poor reliability
- 0.5 - 0.75: Moderate reliability
- 0.75 - 0.9: Good reliability
- 0.90 and over: Excellent reliability
- < 0.5: Poor reliability
- Fleiss’ Kappa:
- < 0: Poor agreement
- 0.01 - 0.20: Slight agreement
- 0.21 - 0.40: Fair agreement
- 0.41 - 0.60: Moderate agreement
- 0.61 - 0.80: Substantial agreement
- 0.81 - 1.00: Almost perfect agreement
- < 0: Poor agreement
5.8.2 Observations
- Continuous Variables (ER, PR, Ki67): Compare the ICC values between Pre-AI and Post-AI. An increase in ICC indicates that AI assistance has improved the consistency among pathologists.
- Categorical/Binned Variables: Look at the Kappa values. Higher Kappa in the Post-AI phase suggests that AI helps pathologists classify cases into the same CAP categories more consistently.
- Confidence Intervals: Check if the confidence intervals overlap. If the Post-AI interval is entirely above the Pre-AI interval, the improvement is statistically significant.
5.8.3 Literature Benchmark
- Ki67 Agreement: A recent study by Dy et al. (2024) demonstrated that AI assistance significantly improved inter-rater agreement for Ki67, with ICC values increasing from 0.70 (without AI) to 0.92 (with AI) (Dy et al. 2024). Our results can be valued against this benchmark, particularly regarding the potential for improvement in the challenging 5-30% proliferation index range.
- Ki67 Repeatability: Li et al. (2022) reported excellent inter-observer repeatability for AI-assisted Ki-67 interpretation, with ICC values exceeding 0.95 across pathologists of varying experience levels (Li et al. 2022). In comparison, visual assessment showed experience-dependent variability (ICC 0.73-0.98), while standard reference cards achieved ICC > 0.88. These findings underscore AI’s role in standardizing Ki-67 assessment regardless of pathologist experience.
- Digital Pathology Concordance: A large multicenter study reported 99.40% overall clinical management concordance between manual microscopy and digital pathology, with 96.27% concordance specifically for cancer screening samples, strongly supporting the integration of digital pathology into breast cancer workflows (Datwani et al. 2025).
- Digital Mitotic Counting Challenges: While digital pathology offers many advantages, Ibrahim et al. (2022) highlighted potential pitfalls in mitotic counting on whole slide images (WSI), noting a ~17% reduction in counts compared to glass slides due to the loss of fine-tuning (z-axis) capabilities and potential haziness (Ibrahim et al. 2022). This underscores the importance of rigorous validation when transitioning to digital workflows for proliferation assessment.
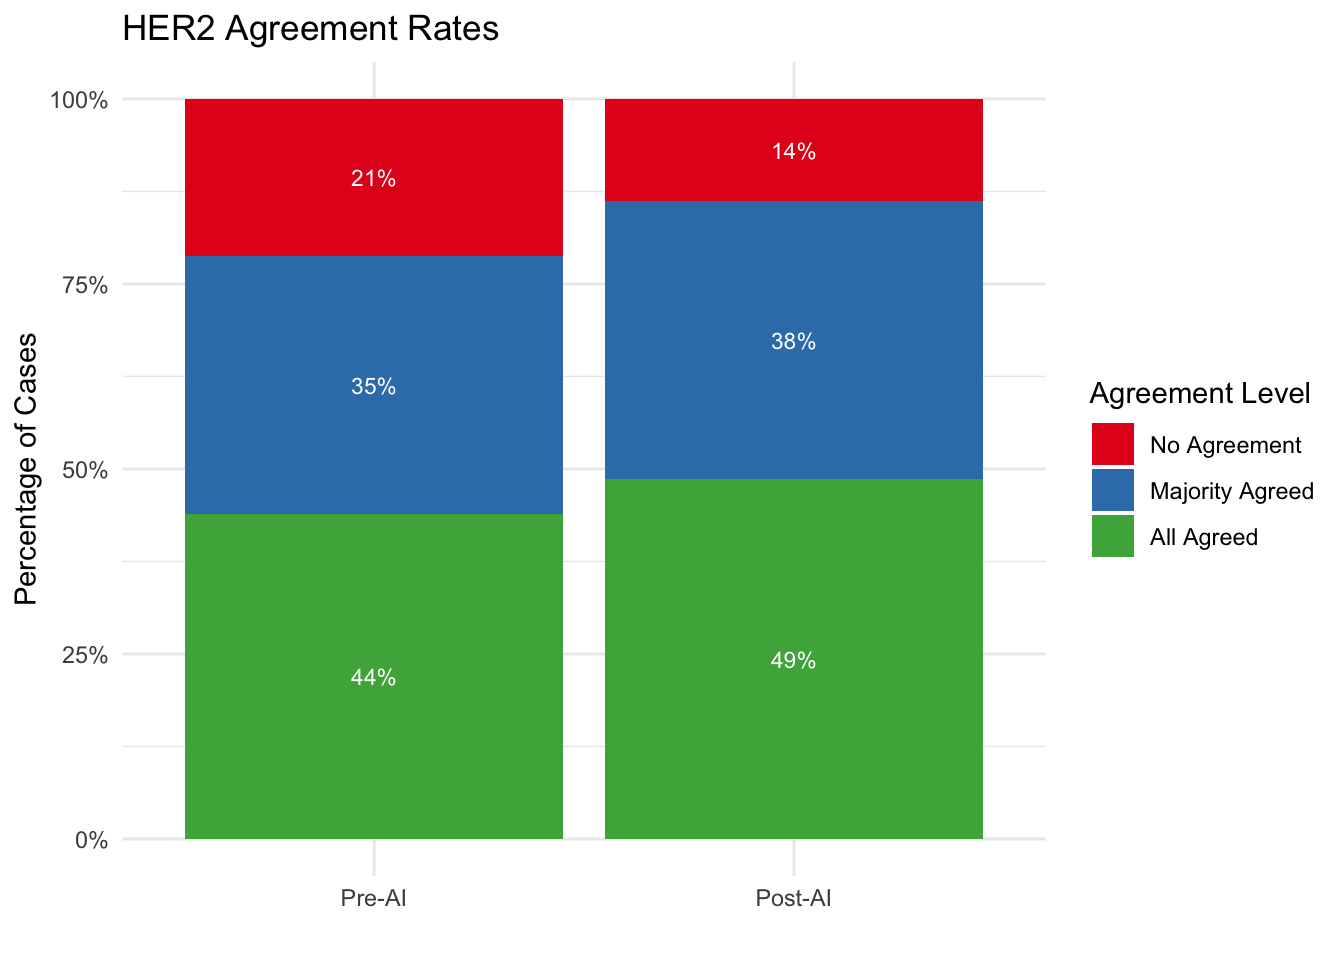
- AI-Augmented Interpretation: Jung et al. (2024) reported strong quantitative evidence for AI’s role in improving inter-observer agreement. In a study of 201 cases, AI assistance significantly improved agreement for HER2 (49.3% to 74.1%), PR (84.6% to 91.5%), and overall molecular subtype classification (58.2% to 78.6%) (Jung et al. 2024). This suggests a particularly high “value add” for resolving discordance in HER2 assessment.
- HER2 Interobserver Variability: Thomson et al. (2001) established that while interobserver agreement for HER2 is high for negative (0) and strongly positive (3+) cases, it is significantly poorer for equivocal (2+) and low positive (1+) cases (Kappa ~0.3-0.5) (Thomson et al. 2001). This historical context highlights the longstanding need for objective tools in the “HER2 Low” range.
- HER2 Low Classification: Palm et al. (2023) highlighted the feasibility of AI in determining HER2 status, including the challenging “HER2 Low” category (IHC 1+ or 2+/ISH-). They found that while standalone AI had only moderate concordance (Kappa 0.59) with the ground truth, pathologists assisting AI achieved almost perfect agreement (Kappa 0.89) (Palm et al. 2023). This supports the “human-in-the-loop” model where AI serves as a powerful decision support tool rather than a replacement.
- Semi-Automated HER2 Analysis: Liao et al. (2024) validated a commercial semi-automated tool for HER2 assessment, achieving substantial agreement with manual scoring (Kappa = 0.77). However, they noted that artifacts such as crush effect and cytoplasmic staining were responsible for most discordances (17% of equivocal cases), reinforcing the necessity of pathologist oversight in AI-assisted workflows (Liao et al. 2024).
- HER2 0 vs 1+ Distinction: Wu et al. (2023) specifically addressed the critical clinical distinction between HER2 Score 0 and 1+ (HER2 Low). They found that AI assistance significantly improved the accuracy of differentiating these scores (0.80 to 0.93) and raised inter-observer consistency (ICC) from 0.54 to 0.81. Notably, while all pathologists benefited, junior pathologists saw the most dramatic improvement, suggesting AI acts as a powerful educational and standardization tool (Wu et al. 2023).
- HER2 Low Sensitivity: Albuquerque et al. (2025) conducted a meta-analysis showing that AI has a high pooled sensitivity (0.97) for identifying patients eligible for T-DXd (Score 1+ vs 0). However, differentiating Score 1+ specifically remains challenging (sensitivity ~0.69), whereas Score 3+ detection is near-perfect (AUC 1.00) (Albuquerque et al. 2025). This suggests AI is highly effective for screening eligibility but requires expert review for borderline low-expression cases.
- Ki-67 Reproducibility: Dy et al. (2024) demonstrated that AI assistance significantly improved inter-rater agreement for Ki-67 assessment (ICC increased from 0.70 to 0.92; Fleiss’ Kappa increased from 0.40 to 0.86) and reduced scoring error from 5.9% to 2.1% (Dy et al. 2024). These findings strongly advocate for AI integration to standardize proliferation indexing.
- Method Comparison for Ki-67: Li et al. (2022) performed a head-to-head comparison of Ki-67 scoring methods. They found that both AI (ICC > 0.97) and Standard Reference Cards (ICC > 0.91) significantly outperformed visual assessment (ICC ~0.75). This suggests that while AI offers the highest reproducibility, simple low-tech interventions like reference cards can also yield substantial improvements (Li et al. 2022).
- Epidemiological Evidence of Variability: Acs et al. (2021) analyzed over 43,000 breast cancer patients in Sweden and found that while ER and HER2 assessments were relatively stable across pathology departments, Ki67 and histological grade suffered from high inter-laboratory variability (median Ki67 varying from 15% to 30%). This underscores the critical need for standardization technologies like AI, as such variability directly affects clinical decision-making and treatment eligibility (Acs et al. 2021).
5.9 Forest Plots
Visualize agreement metrics with confidence intervals for easy comparison.
5.10 Bland-Altman Plots
Assess agreement between Pre-AI and Post-AI assessments.
Note: The Bland-Altman analysis below pools observations across all four pathologists to provide an overall summary. Because within-pathologist and between-pathologist variation are conflated, limits of agreement may be wider than per-pathologist analyses.
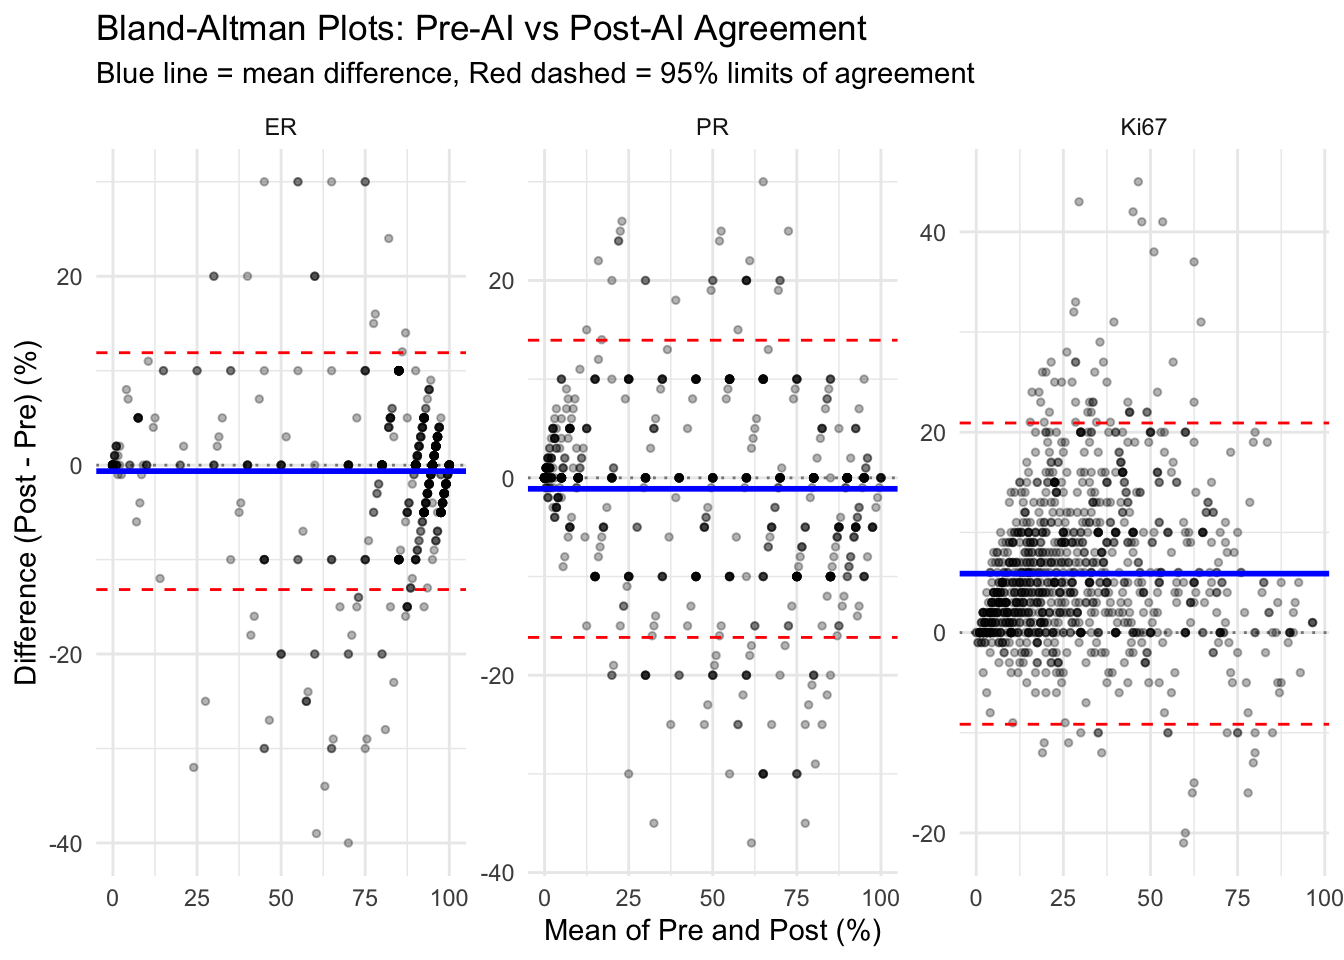
| Bland-Altman Analysis Statistics | ||||
| Marker | Mean Difference | SD | Upper LoA (95%) | Lower LoA (95%) |
|---|---|---|---|---|
| ER | −0.63 | 6.40 | 11.90 | −13.17 |
| PR | −1.11 | 7.68 | 13.95 | −16.17 |
| Ki67 | 5.89 | 7.67 | 20.92 | −9.15 |
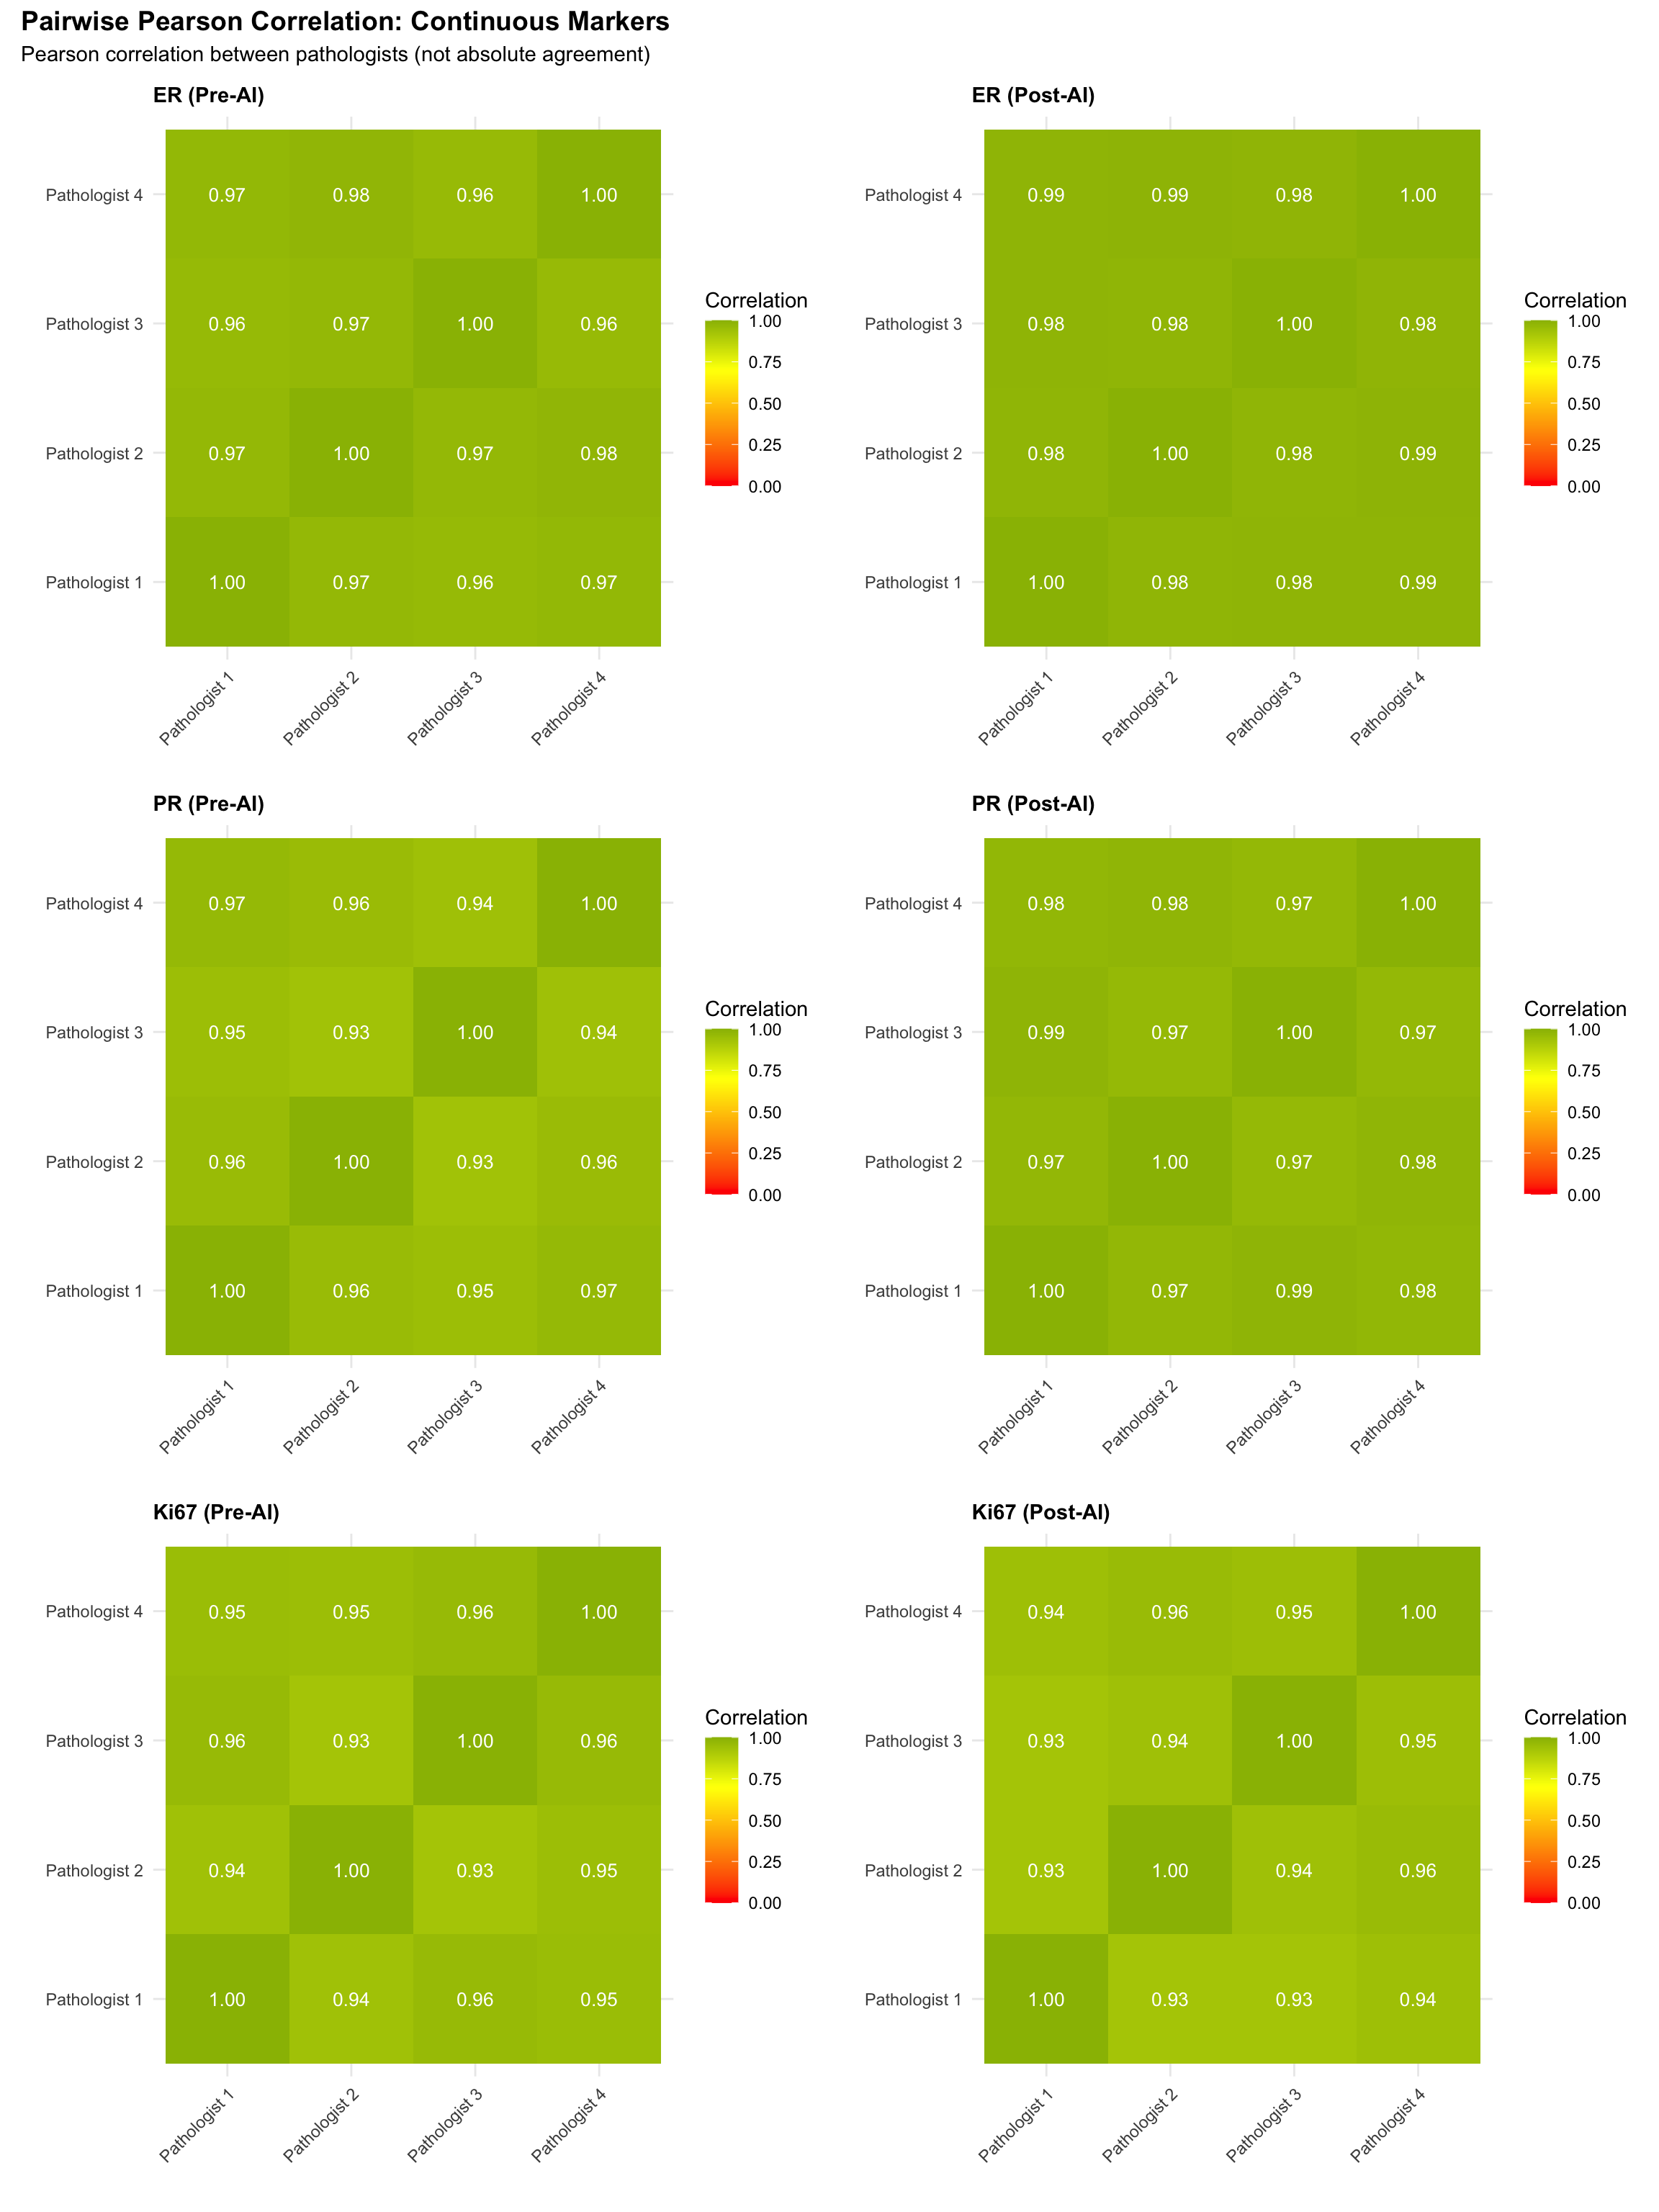
5.11 Pairwise Correlation Heatmaps
Visualize pairwise linear association between pathologists for continuous markers.
Note: Pearson correlation measures linear association, not agreement. Two raters can have perfect correlation (r=1) with poor absolute agreement (constant bias). These heatmaps illustrate relative ranking consistency; see the Lin’s CCC heatmaps below for absolute agreement.
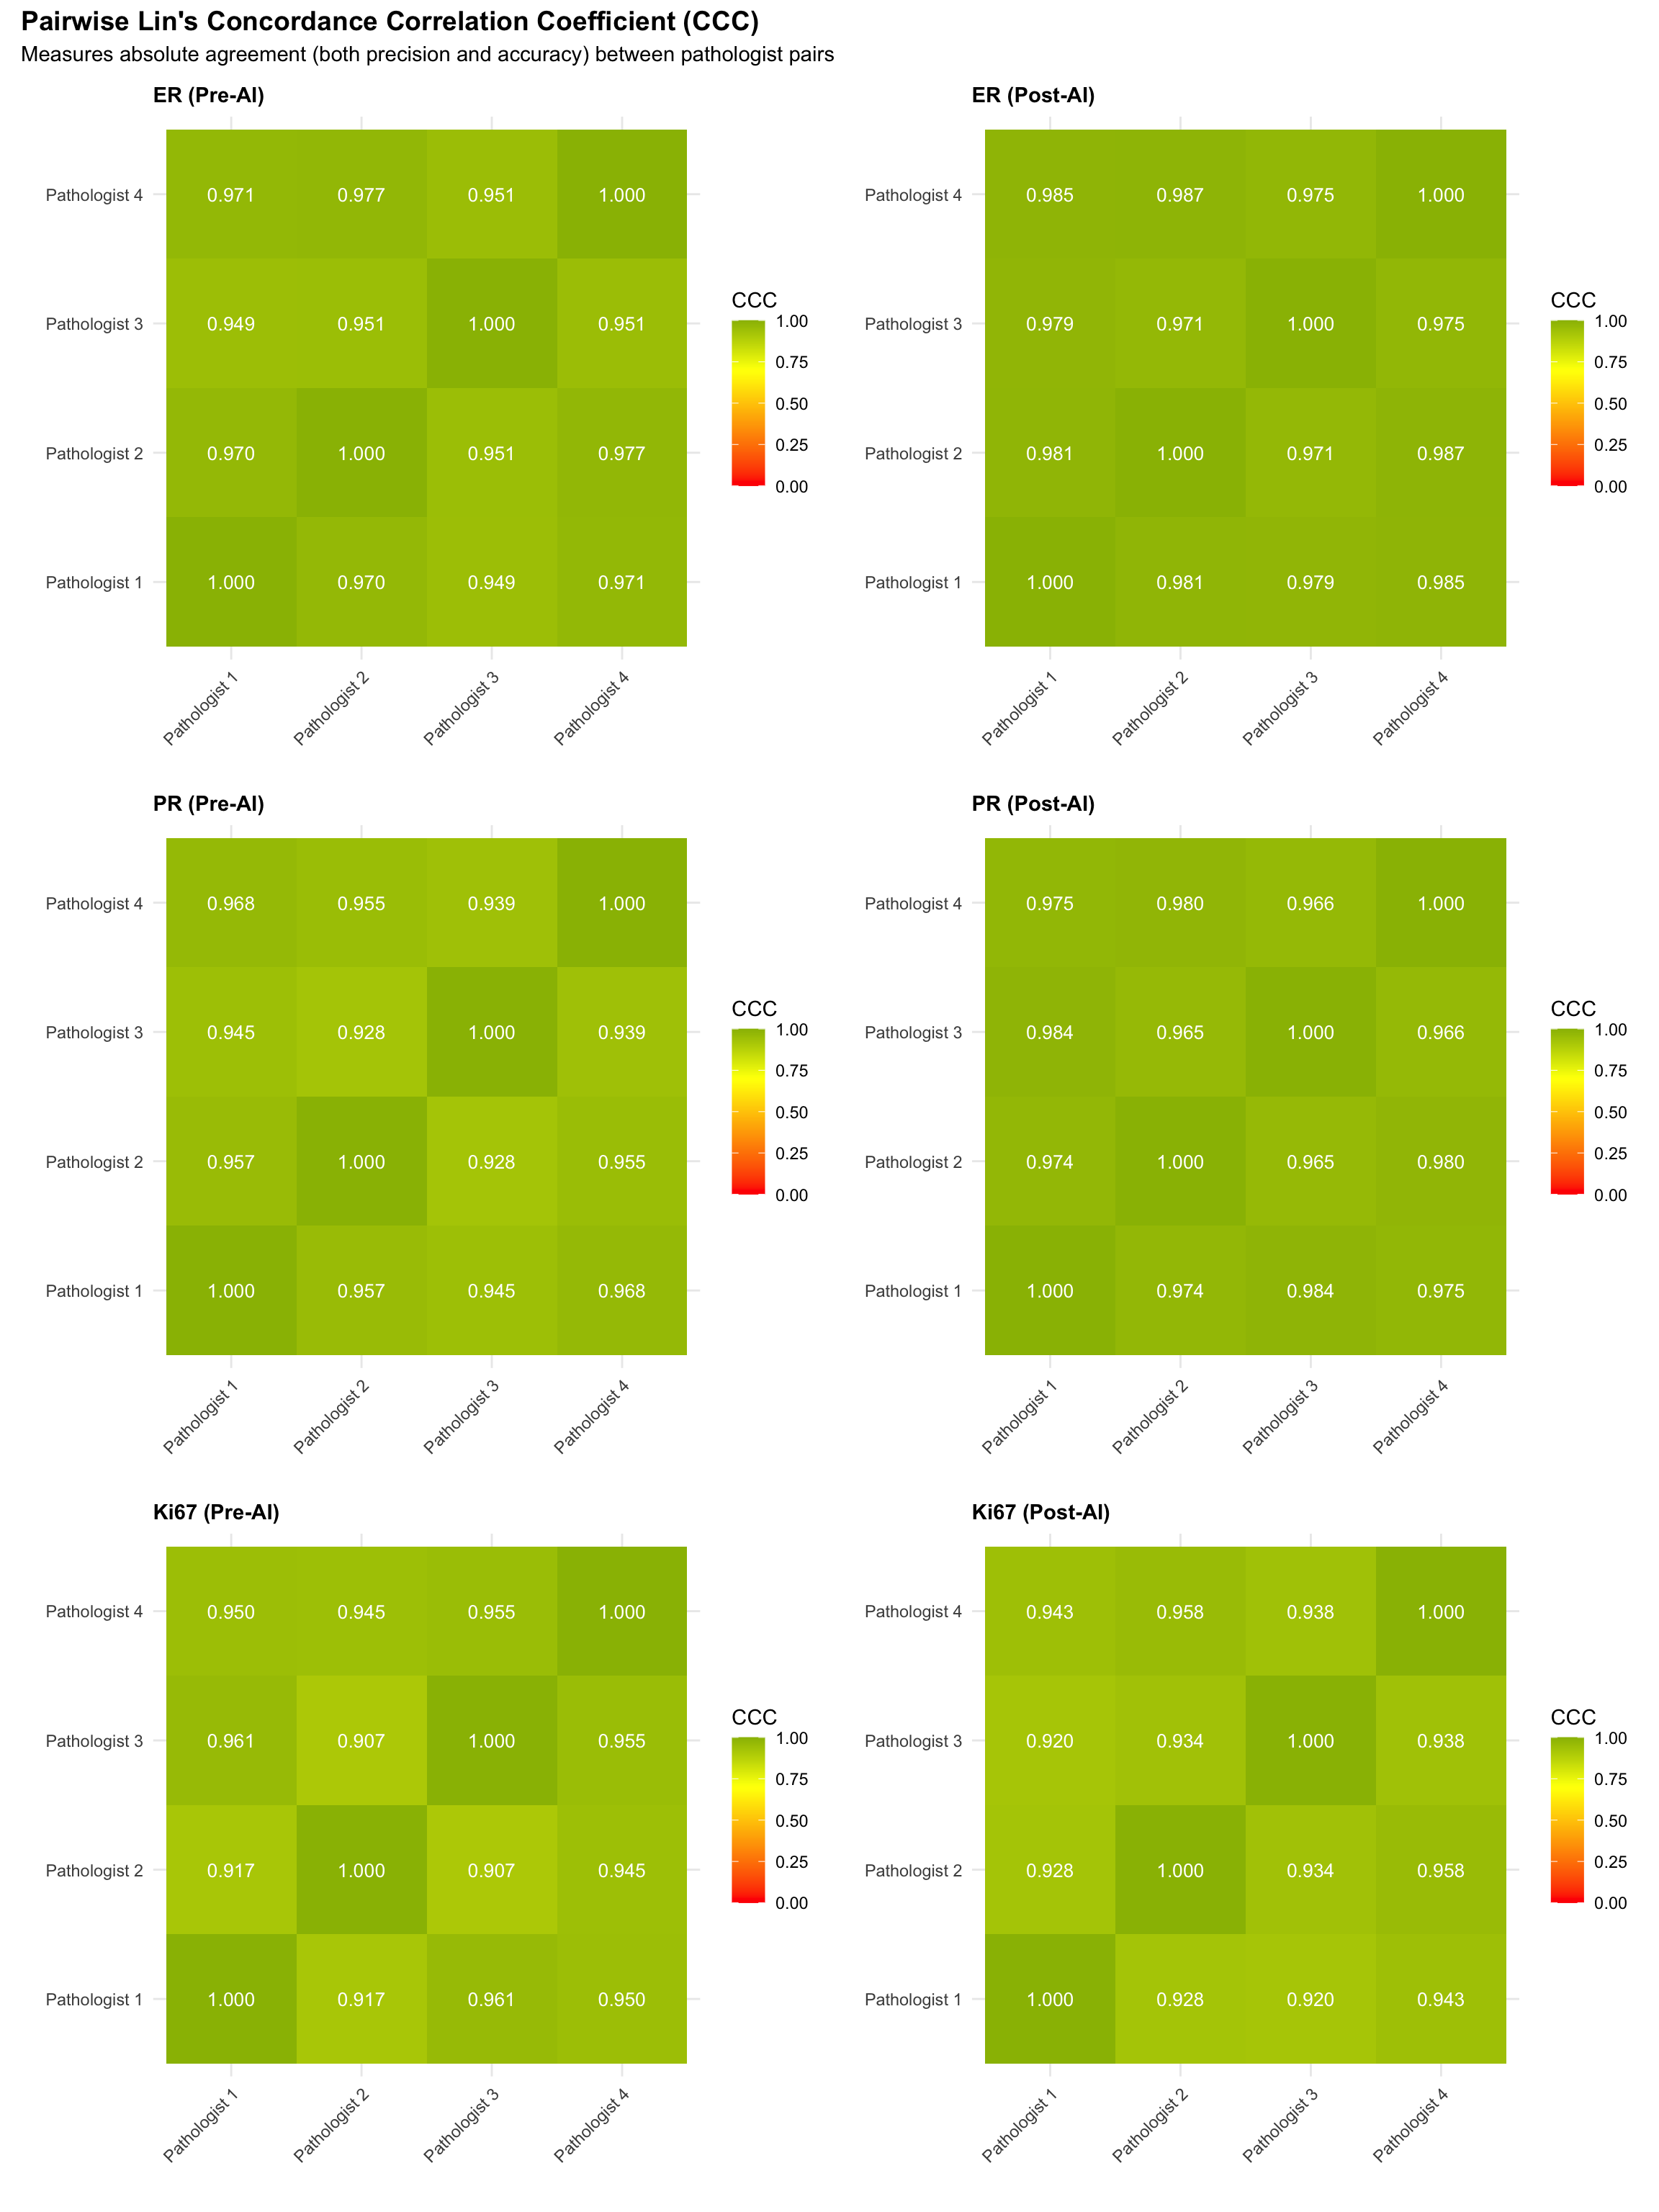
5.11.1 Pairwise Lin’s Concordance Correlation Coefficient (CCC)
Unlike Pearson correlation, Lin’s CCC measures both precision (correlation) and accuracy (closeness to the identity line), providing a single index of absolute agreement between two raters. CCC = 1 means perfect agreement; CCC = 0 means no agreement.
5.11.2 Pairwise Agreement Heatmaps (Categorical Markers)
For categorical variables, Pearson correlation is not appropriate. Instead, we compute pairwise Cohen’s Kappa to measure agreement between each pair of pathologists. For ordinal HER2 scores, we use quadratic-weighted Cohen’s Kappa.
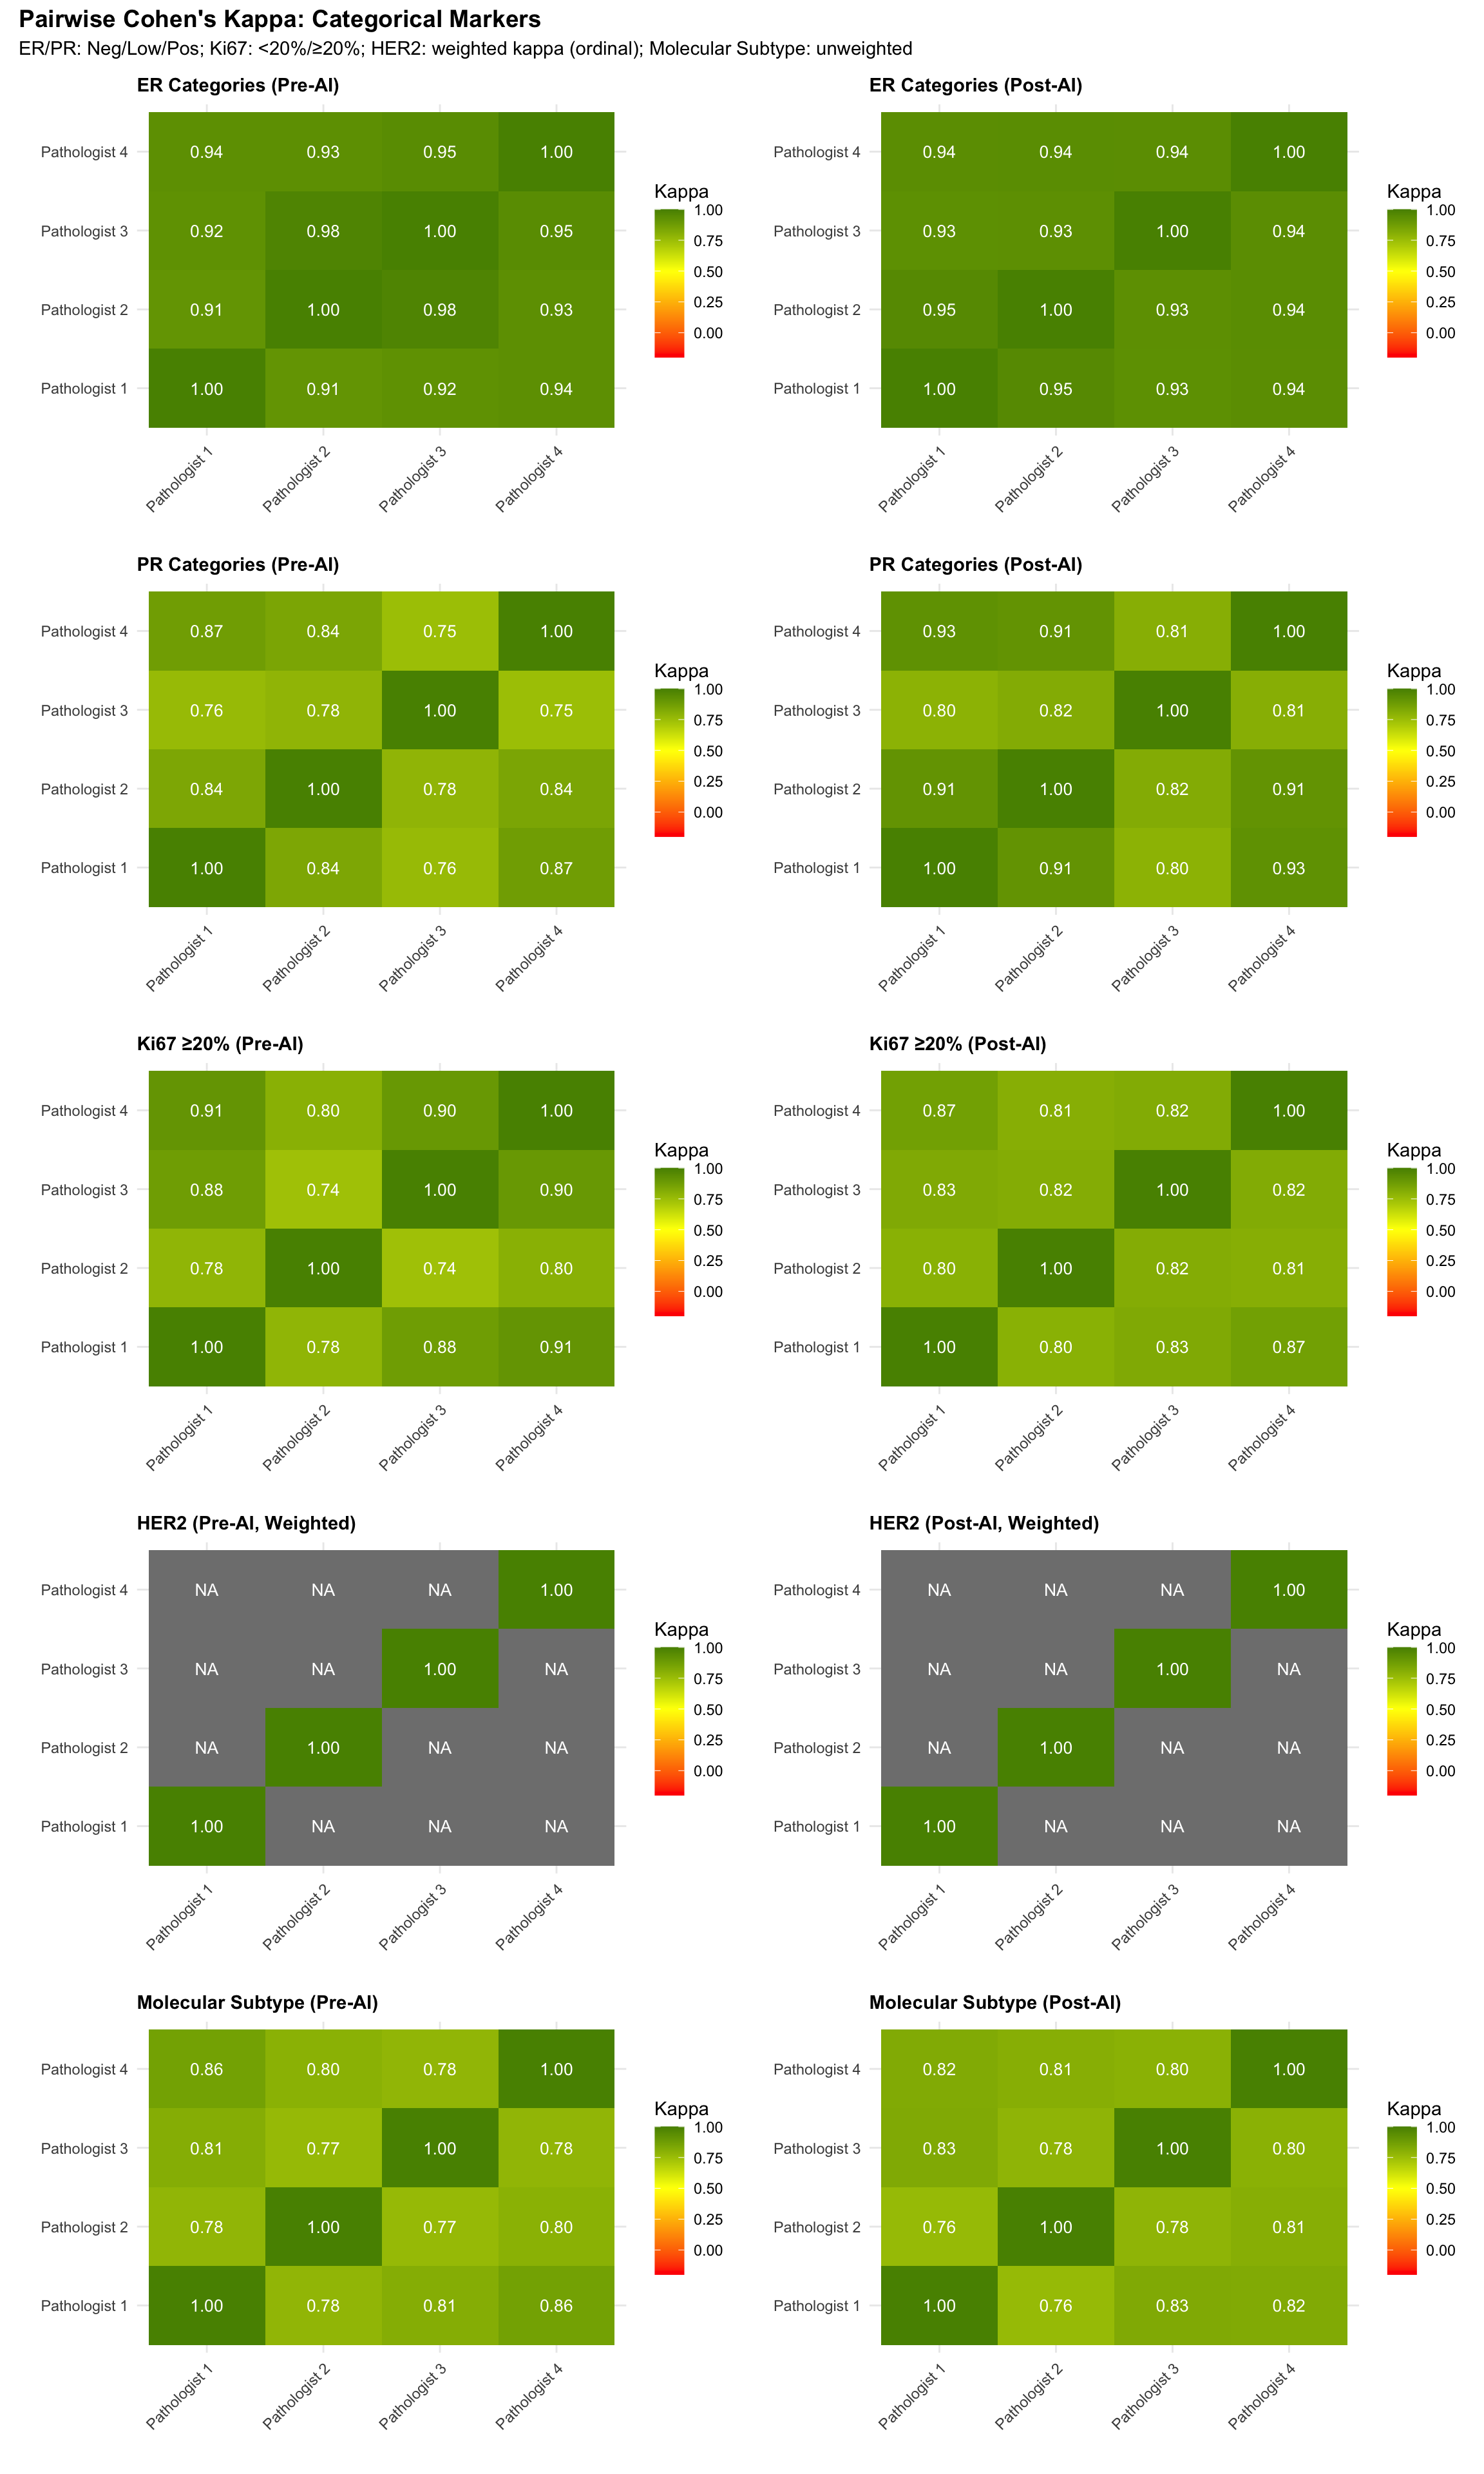
5.11.3 Pairwise Agreement Summary Table
| Mean Pairwise Cohen's Kappa by Marker | |||
| Average of all 6 pathologist-pair kappas | |||
| Marker | Pre-AI (Mean κ) | Post-AI (Mean κ) | Δ (Post − Pre)1 |
|---|---|---|---|
| ER | 0.938 | 0.941 | 0.003 |
| PR | 0.808 | 0.863 | 0.055 |
| Ki67 (≥20%) | 0.834 | 0.823 | −0.011 |
| HER2 (weighted) | NaN | NaN | NaN |
| Molecular Subtype | 0.799 | 0.800 | 0.001 |
| 1 HER2 uses quadratic-weighted Cohen's kappa; all others use unweighted kappa | |||
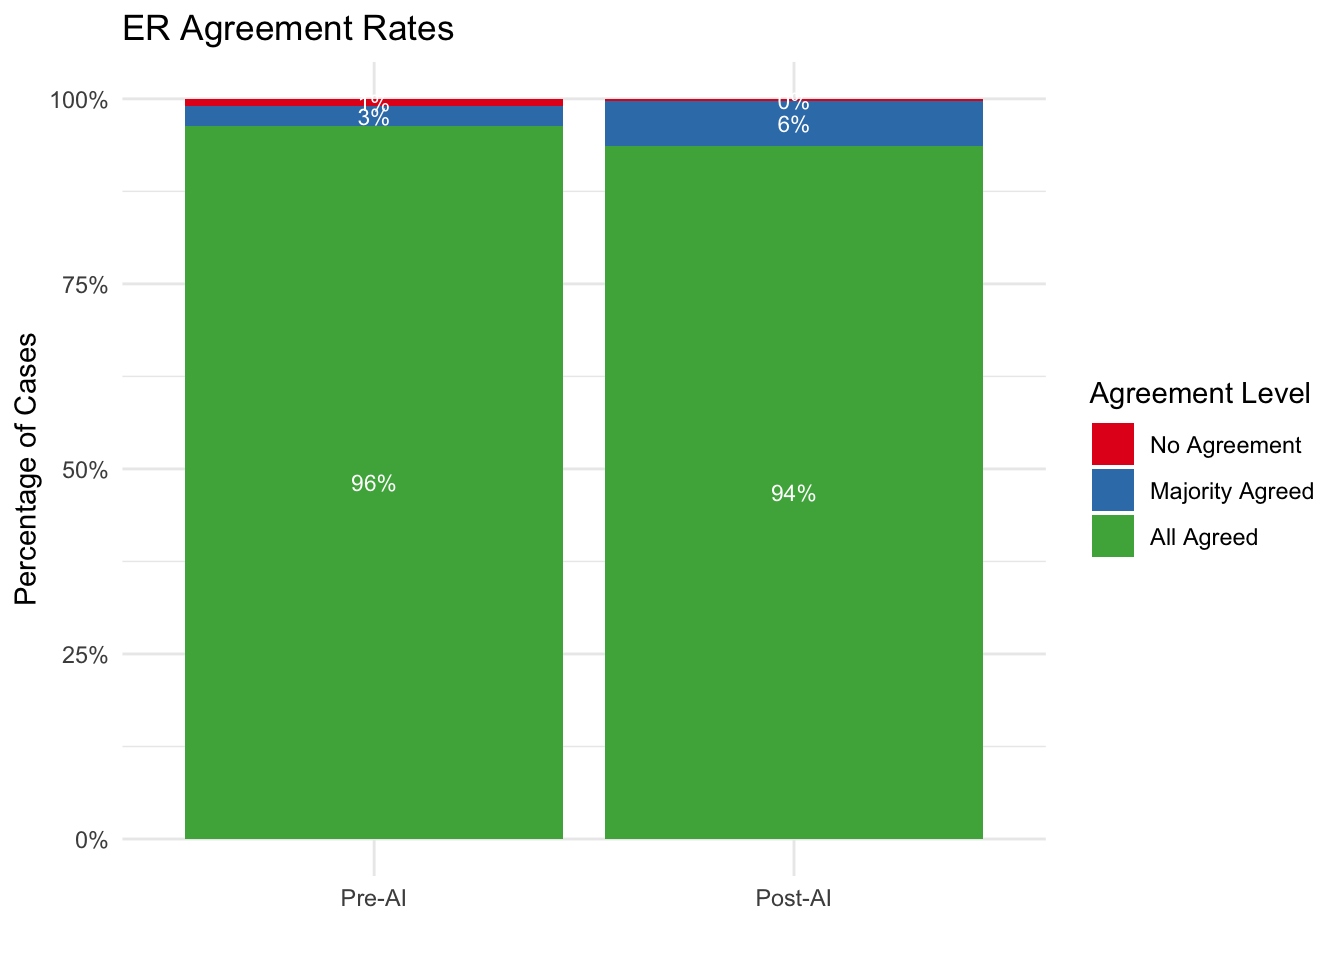
5.12 Agreement Rate Analysis
We categorize each case based on the level of consensus among pathologists:
- All Agreed: 100% (4/4) of pathologists assigned the same category.
- Majority Agreed: 75% (3/4) of pathologists assigned the same category.
- No Agreement: 50% or less (<= 2/4) agreement.
5.12.1 Agreement Rate Tables
| Consensus Levels by Marker | ||||
| Comparison of Pre-AI vs Post-AI Agreement | ||||
| Agreement Level |
Pre-AI
|
Post-AI
|
||
|---|---|---|---|---|
| N | % | N | % | |
| ER | ||||
| No Agreement | 3 | 1.0% | 1 | 0.3% |
| Majority Agreed | 8 | 2.7% | 18 | 6.1% |
| All Agreed | 285 | 96.3% | 277 | 93.6% |
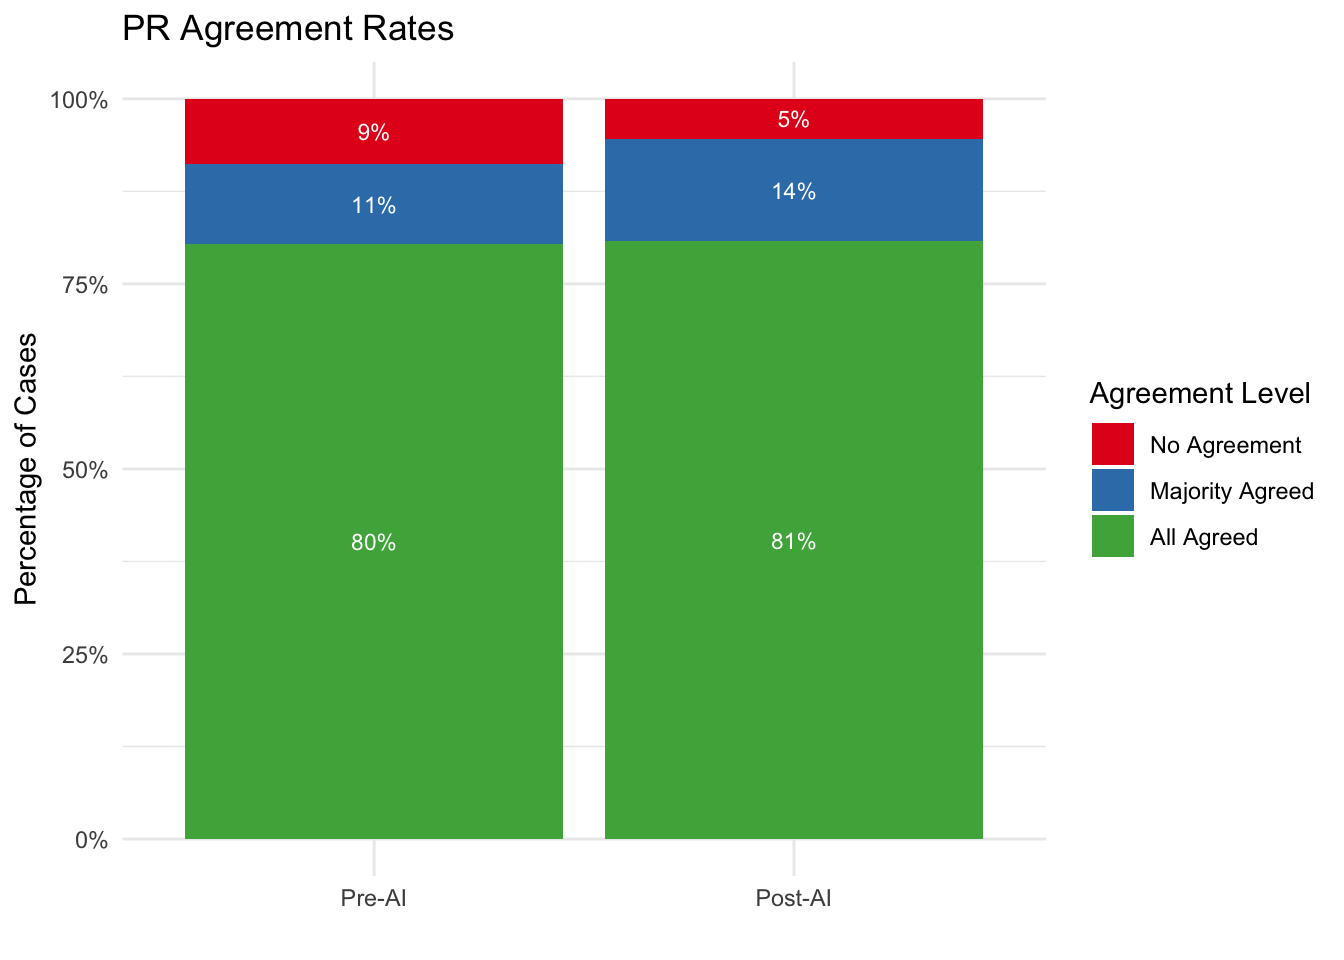
| PR | ||||
| No Agreement | 26 | 8.8% | 16 | 5.4% |
| Majority Agreed | 32 | 10.8% | 41 | 13.9% |
| All Agreed | 238 | 80.4% | 239 | 80.7% |
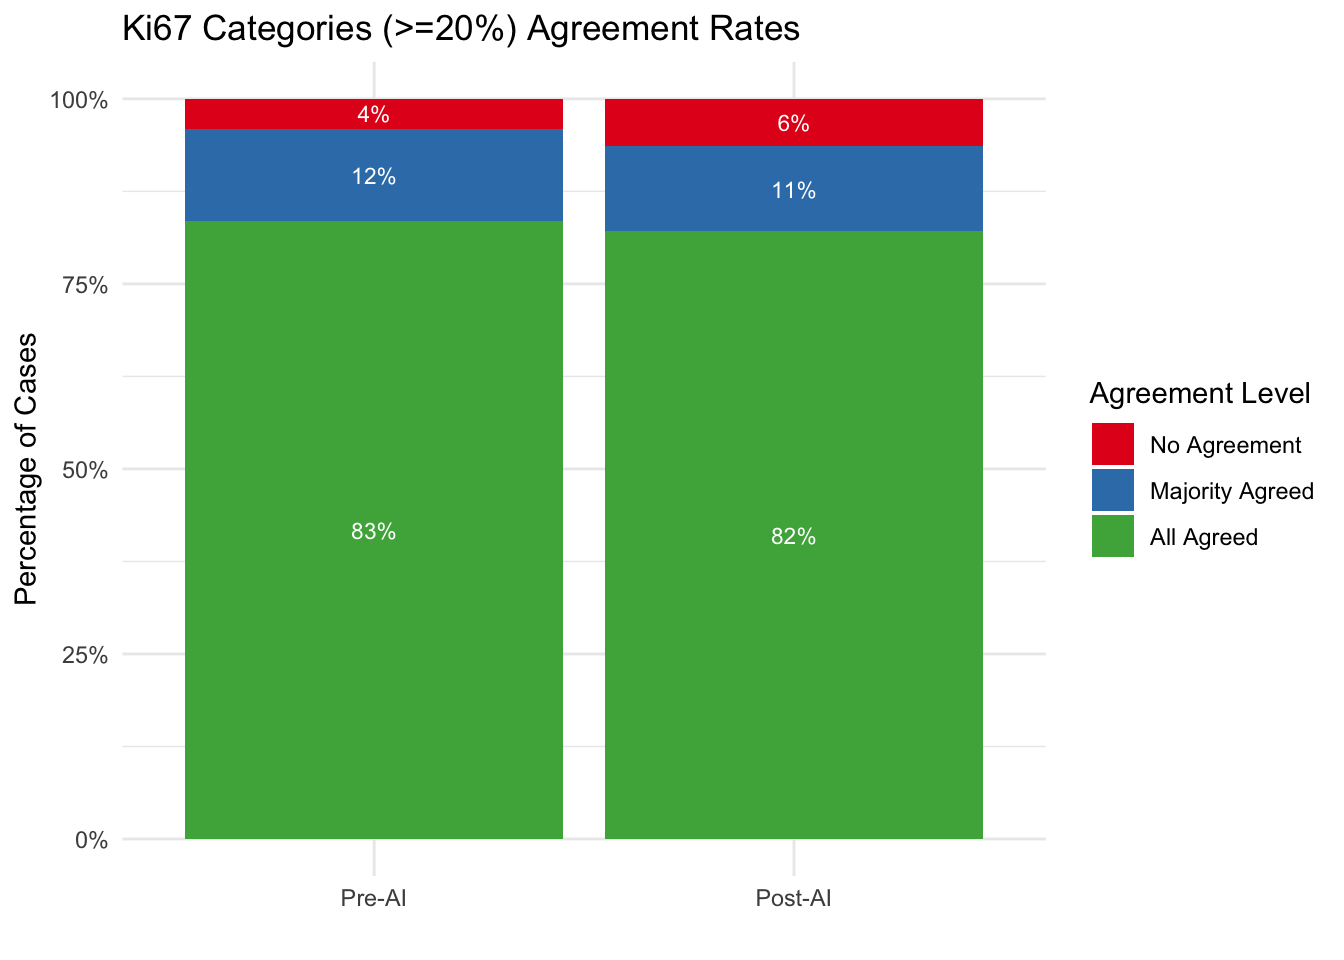
| Ki67 | ||||
| No Agreement | 12 | 4.1% | 19 | 6.4% |
| Majority Agreed | 37 | 12.5% | 34 | 11.5% |
| All Agreed | 247 | 83.4% | 243 | 82.1% |
| HER2 | ||||
| No Agreement | 63 | 21.3% | 41 | 13.9% |
| Majority Agreed | 103 | 34.8% | 111 | 37.5% |
| All Agreed | 130 | 43.9% | 144 | 48.6% |
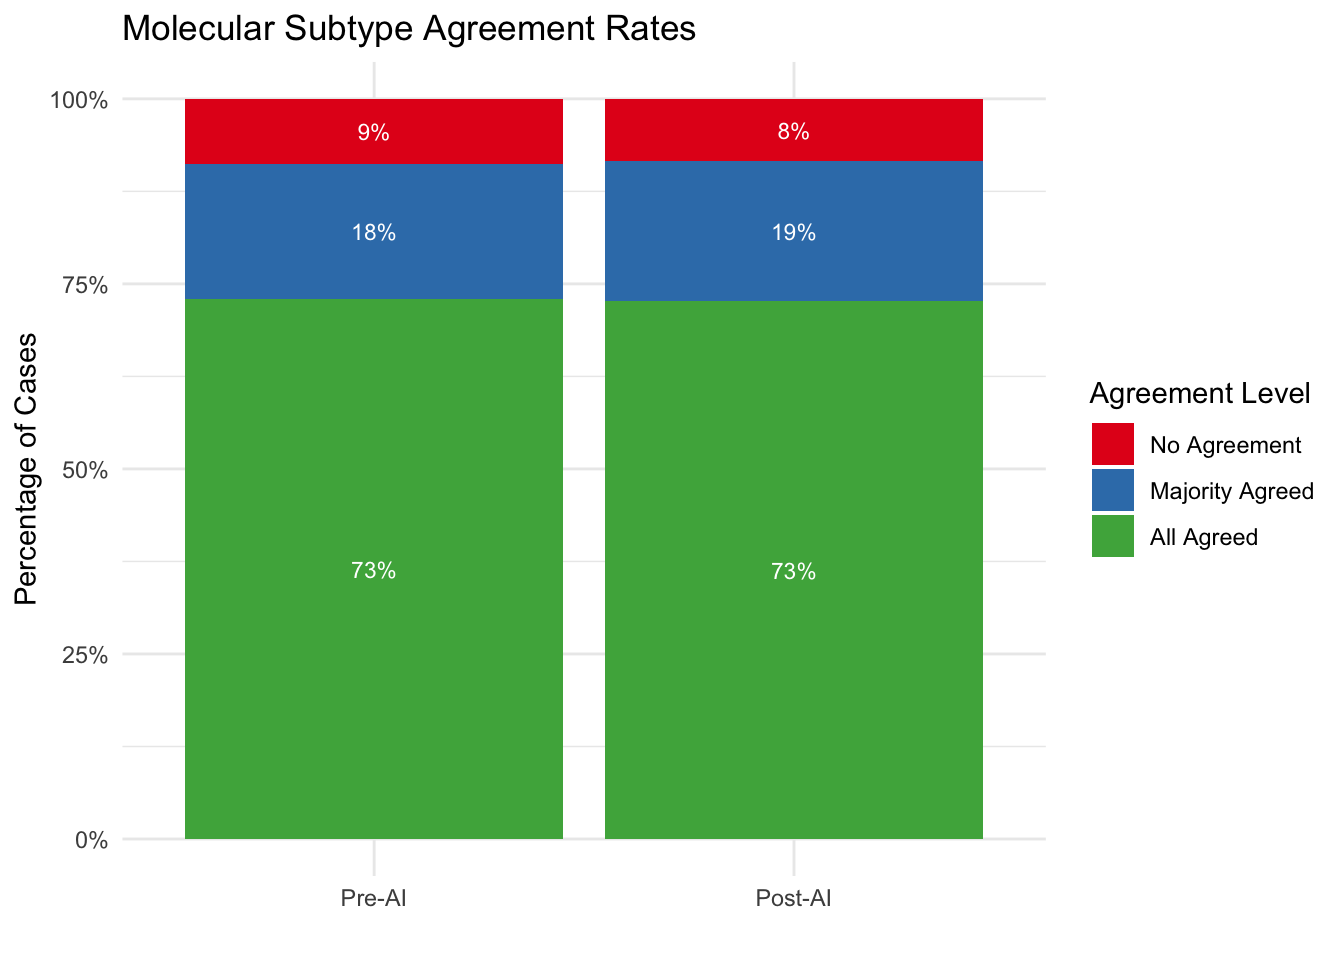
| Molecular Subtype | ||||
| No Agreement | 26 | 8.8% | 25 | 8.4% |
| Majority Agreed | 54 | 18.2% | 56 | 18.9% |
| All Agreed | 216 | 73.0% | 215 | 72.6% |
5.13 Agreement by Biopsy Type
Analyze whether inter-observer agreement varies by biopsy type (Excision, Tru-cut).
[1] "Biopsy type data available for stratified analysis"
Excision Tru-cut
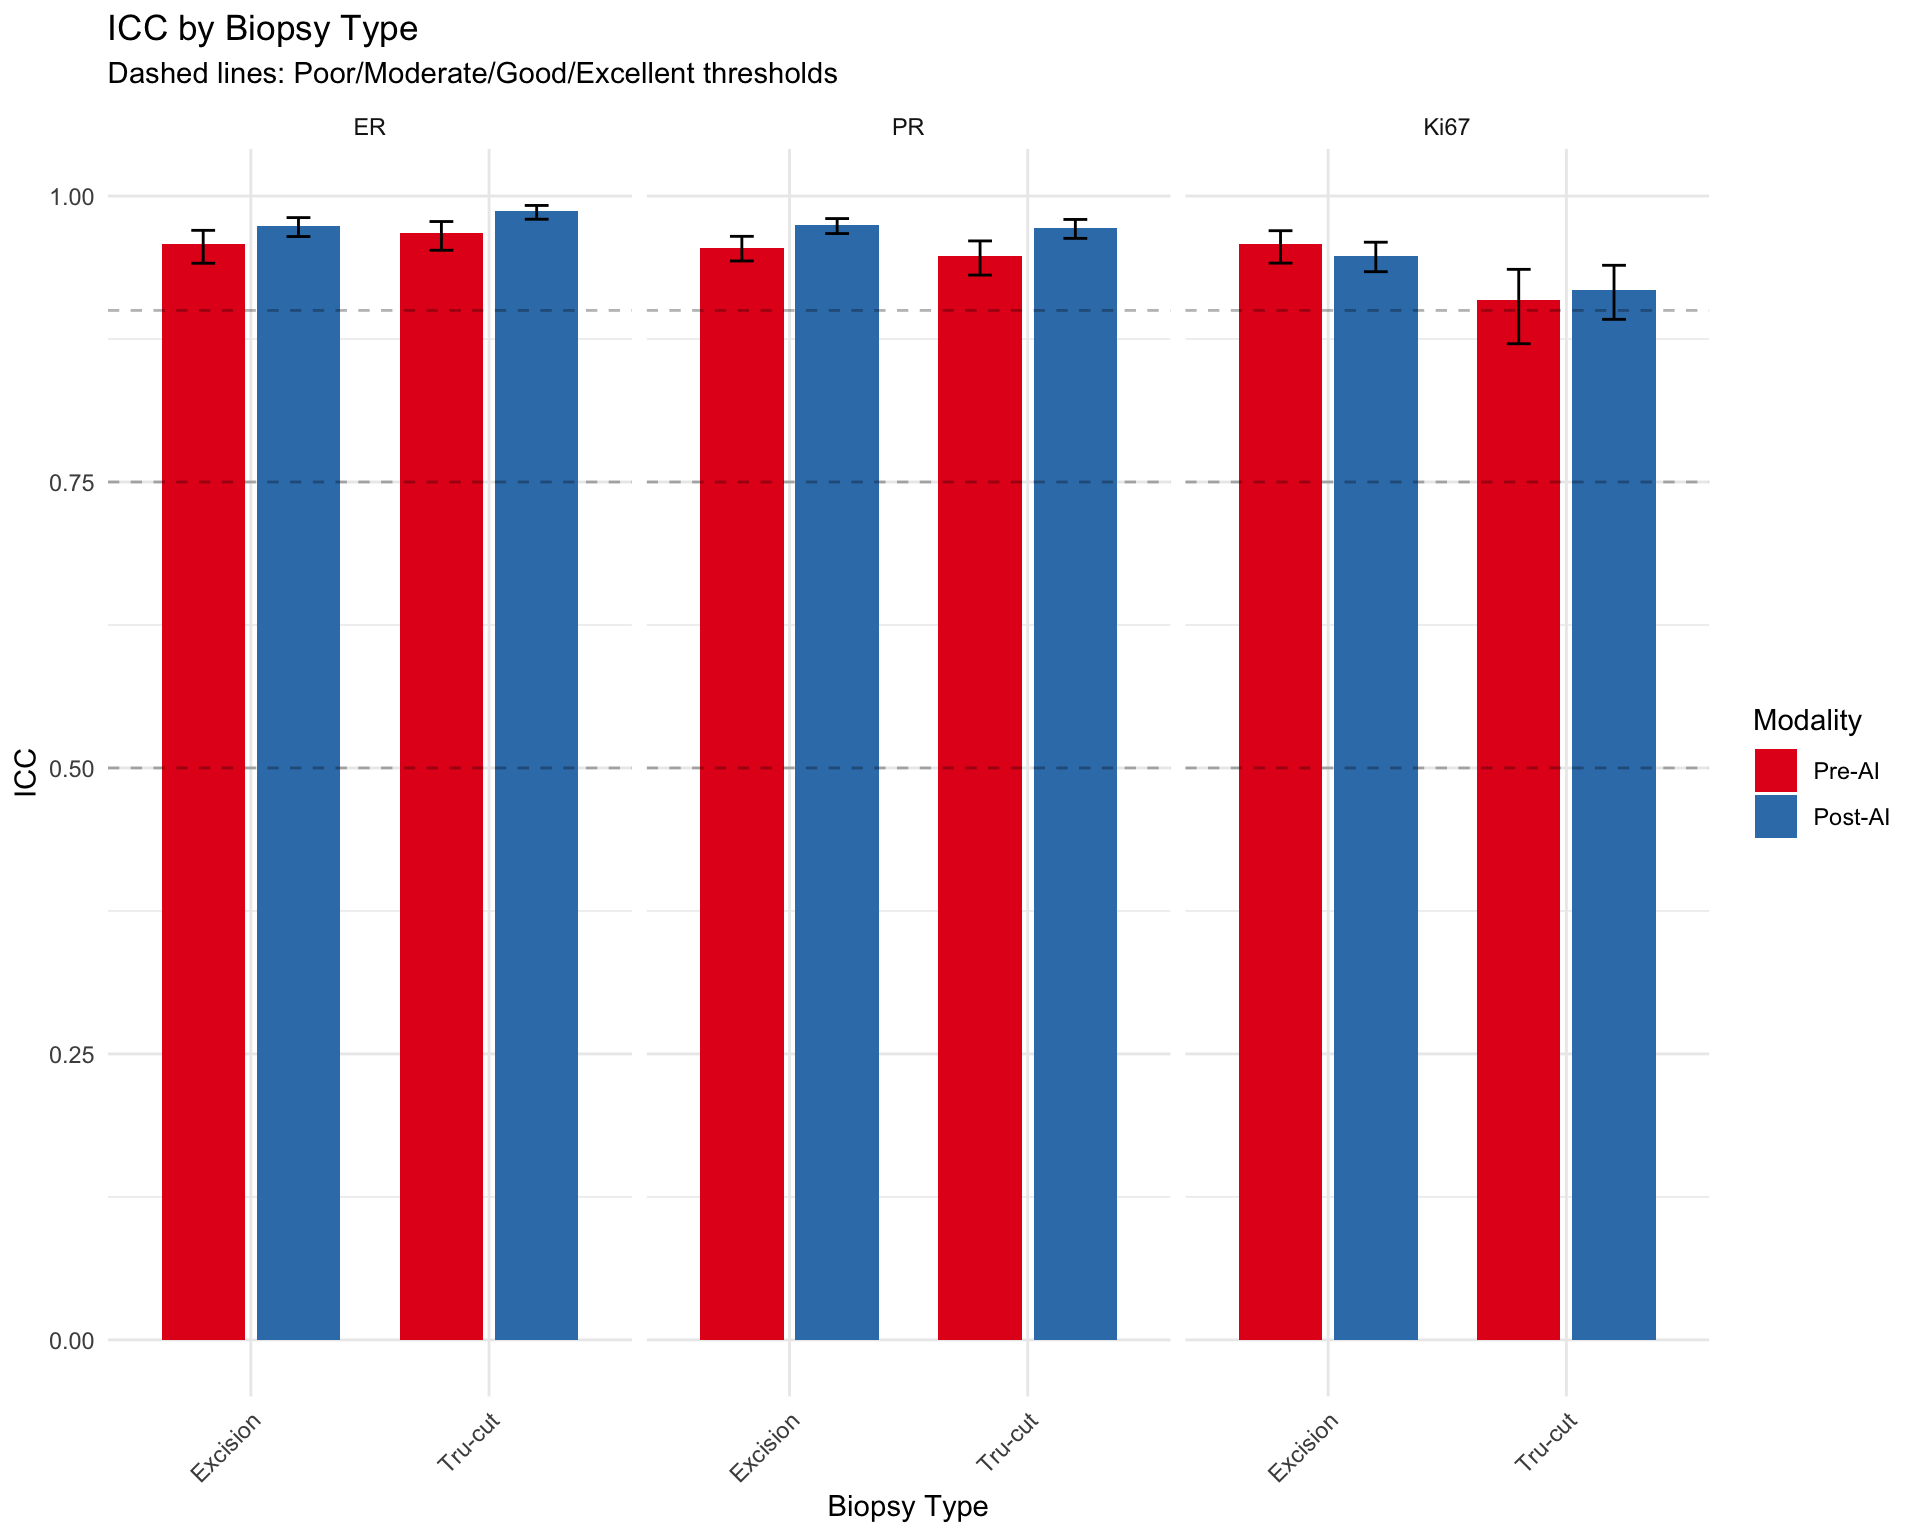
696 488 5.13.1 ICC by Biopsy Type (Continuous Markers)
| ICC by Biopsy Type | ||||
| Inter-observer agreement for continuous markers stratified by biopsy type | ||||
| Modality | ICC | 95% CI Lower | 95% CI Upper | N Cases |
|---|---|---|---|---|
| ER — Excision | ||||
| Pre-AI | 0.958 | 0.941 | 0.970 | 173 |
| Post-AI | 0.974 | 0.965 | 0.981 | 170 |
| ER — Tru-cut | ||||
| Pre-AI | 0.968 | 0.953 | 0.978 | 122 |
| Post-AI | 0.987 | 0.980 | 0.992 | 117 |
| PR — Excision | ||||
| Pre-AI | 0.955 | 0.943 | 0.965 | 173 |
| Post-AI | 0.974 | 0.967 | 0.980 | 164 |
| PR — Tru-cut | ||||
| Pre-AI | 0.947 | 0.931 | 0.961 | 120 |
| Post-AI | 0.972 | 0.963 | 0.980 | 114 |
| Ki67 — Excision | ||||
| Pre-AI | 0.958 | 0.941 | 0.970 | 171 |
| Post-AI | 0.948 | 0.934 | 0.960 | 167 |
| Ki67 — Tru-cut | ||||
| Pre-AI | 0.909 | 0.871 | 0.936 | 120 |
| Post-AI | 0.918 | 0.892 | 0.939 | 115 |
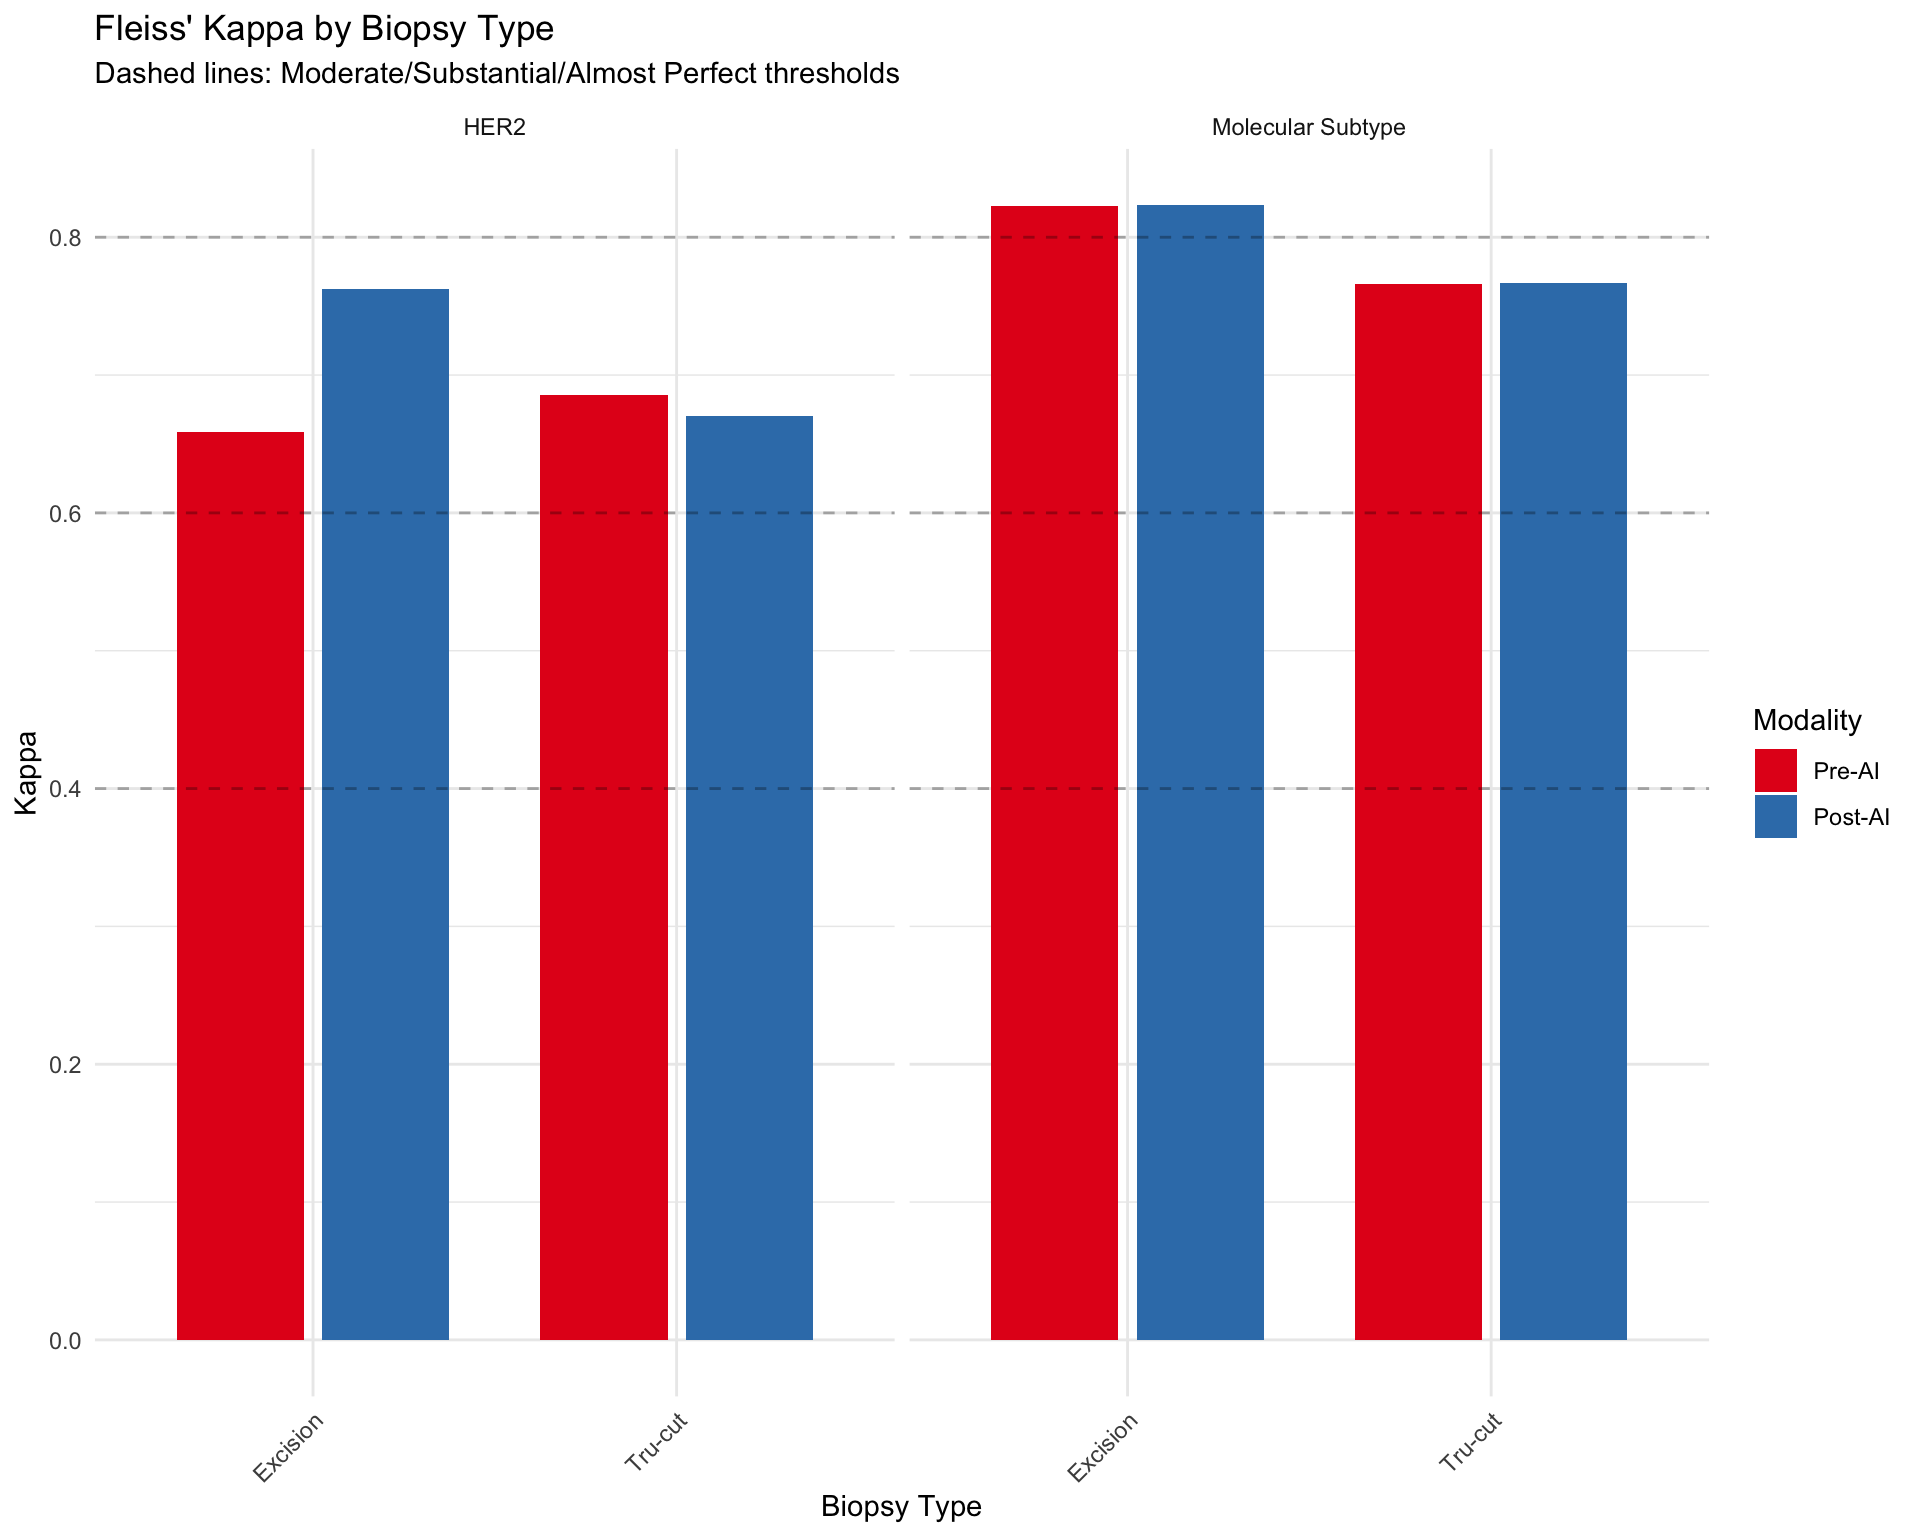
5.13.2 Kappa by Biopsy Type (Categorical Markers)
| Fleiss' Kappa by Biopsy Type | |||
| Inter-observer agreement for categorical markers stratified by biopsy type | |||
| Modality | Kappa | p-value | N Cases |
|---|---|---|---|
| HER2 — Excision | |||
| Pre-AI | 0.659 | 0.00 | 135 |
| Post-AI | 0.762 | 0.00 | 130 |
| HER2 — Tru-cut | |||
| Pre-AI | 0.686 | 0.00 | 94 |
| Post-AI | 0.671 | 0.00 | 96 |
| Molecular Subtype — Excision | |||
| Pre-AI | 0.823 | 0.00 | 174 |
| Post-AI | 0.823 | 0.00 | 174 |
| Molecular Subtype — Tru-cut | |||
| Pre-AI | 0.766 | 0.00 | 122 |
| Post-AI | 0.767 | 0.00 | 122 |
5.13.3 Visualization: Agreement by Biopsy Type
5.13.4 Summary: Does Biopsy Type Affect Agreement?
### Key Observations

**Continuous Markers (ER, PR, Ki67):**
- Excision: Mean ICC = 0.961 (n=6 observations)
- Tru-cut: Mean ICC = 0.950 (n=6 observations)

**Categorical Markers (HER2, Molecular Subtype):**
- Excision: Mean Kappa = 0.767 (n=4 observations)
- Tru-cut: Mean Kappa = 0.722 (n=4 observations)

**Note:** Differences in agreement by biopsy type may reflect:
1. Tissue quality differences (e.g., crush artifacts in smaller biopsies)
2. Sample size variation (larger excisions may have more heterogeneity)
3. Case complexity (biopsy type may correlate with clinical stage)
5.14 Weighted Kappa for Ordinal HER2 Scoring
HER2 immunohistochemistry has an inherent ordinal structure (0 < 1+ < 2+ < 3+), where disagreements between adjacent categories (e.g., 0 vs 1+) are less serious than distant disagreements (e.g., 0 vs 3+). Standard Fleiss’ Kappa treats all disagreements equally (nominal scale), potentially underestimating agreement for ordinal data.
5.14.1 Rationale for Weighted Kappa
Weighted Kappa assigns partial credit to near-miss disagreements:
- Quadratic weights: Penalties increase quadratically with distance (0 vs 1+ gets less penalty than 0 vs 3+)
- Linear weights: Penalties increase linearly with distance
Quadratic weights are preferred for HER2 scoring because:
1. Adjacent category disagreements (e.g., 2+ vs 3+) are common due to staining intensity subjectivity
2. Distant disagreements (e.g., 0 vs 3+) represent fundamental scoring errors
3. Clinical impact differs by distance (2+ vs 3+ requires FISH confirmation, but both may lead to HER2+ diagnosis)
5.14.2 Implementation
| HER2 Agreement: Weighted vs Unweighted Kappa | ||||
| Quadratic weights account for ordinal structure (0 < 1+ < 2+ < 3+) | ||||
| Condition | Unweighted Kappa (Nominal) | Weighted Kappa (Ordinal) | Difference (W - UW)1 | N Cases |
|---|---|---|---|---|
| Pre-AI | 0.671 | NaN | NaN | 229 |
| Post-AI | 0.726 | NaN | NaN | 226 |
| 1 Positive difference indicates weighted kappa > unweighted, suggesting ordinal structure matters | ||||
5.14.3 Interpretation of Weighted vs Unweighted Kappa
### Interpretation:**Pre-AI:**- Unweighted Kappa: 0.671- Weighted Kappa: NaN
**Post-AI:**- Unweighted Kappa: 0.726- Weighted Kappa: NaN
**AI Impact:**- Change in unweighted Kappa: 0.055
**Clinical Implications:**5.14.4 Distribution of HER2 Disagreements by Distance
Examine whether AI reduces distant disagreements more than adjacent disagreements.
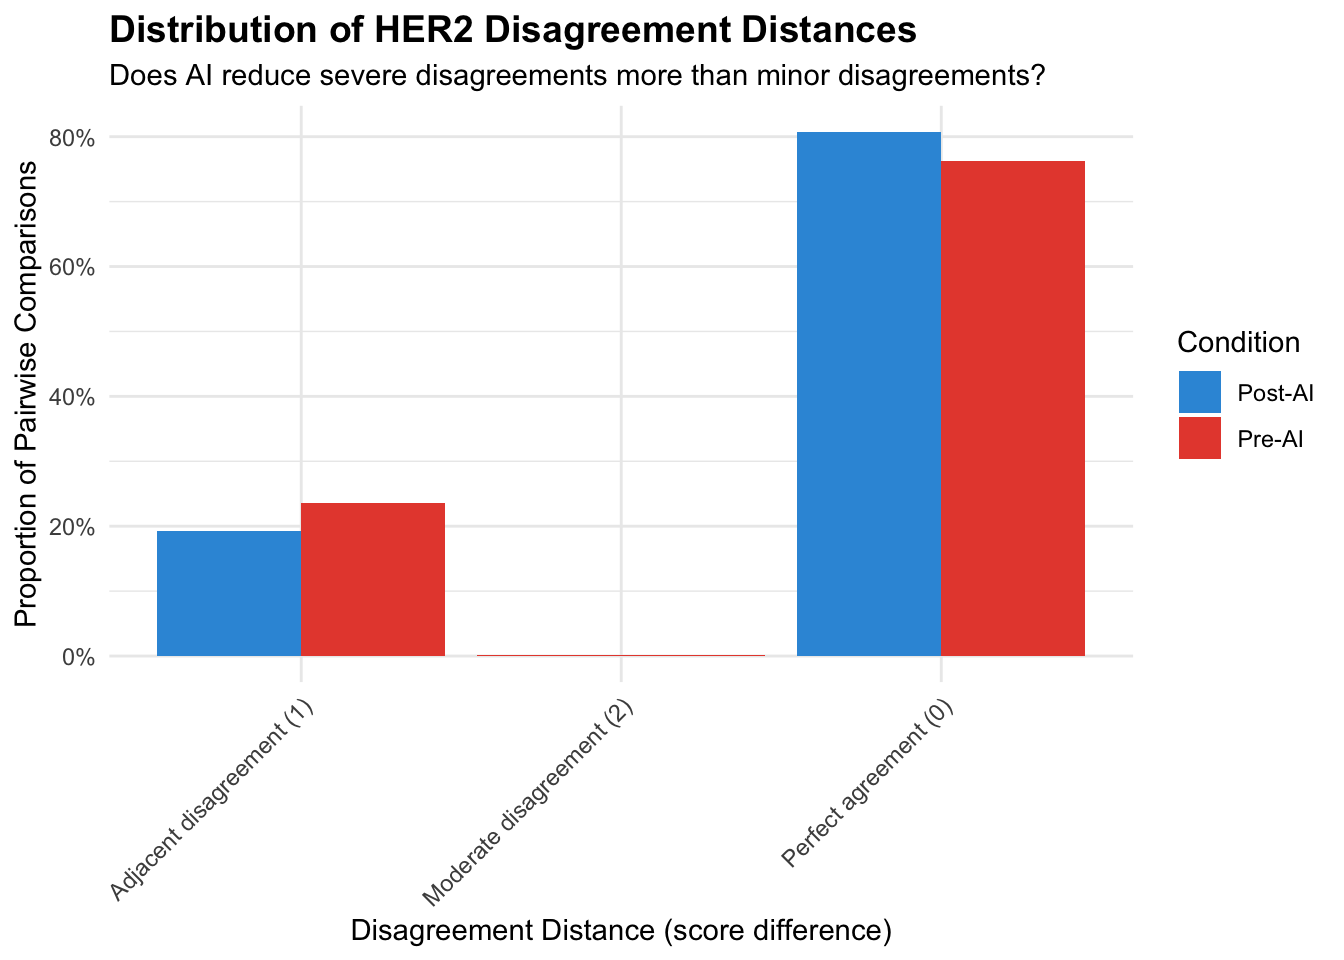
| HER2 Disagreement Distance Analysis | ||||||
| Change in disagreement patterns: Pre-AI vs Post-AI | ||||||
| Disagreement Type | N (Pre) | N (Post) | % (Pre) | % (Post) | Δ N | Δ % |
|---|---|---|---|---|---|---|
| Perfect agreement (0) | 1048 | 1095 | 0.763 | 0.808 | +47.000 | +0.045 |
| Adjacent disagreement (1) | 324 | 261 | 0.236 | 0.192 | −63.000 | −0.043 |
| Moderate disagreement (2) | 2 | NA | 0.001 | NA | NA | NA |
5.14.5 Weighted Kappa: Key Takeaways
Ordinal vs Nominal: Weighted kappa accounts for HER2’s ordinal structure (0 < 1+ < 2+ < 3+), providing more clinically relevant agreement estimates than unweighted kappa.
Interpretation Guidance:
- If weighted kappa > unweighted kappa: Most disagreements are adjacent categories (clinically less serious)
- If weighted kappa ≈ unweighted kappa: Disagreements are evenly distributed across all distances (more severe)
- If weighted kappa > unweighted kappa: Most disagreements are adjacent categories (clinically less serious)
AI Impact on Ordinal Structure:
- Compare weighted kappa change vs unweighted kappa change
- Larger change in weighted kappa suggests AI specifically reduces severe (distant) disagreements
- Compare weighted kappa change vs unweighted kappa change
Recommendation for Reporting:
- Primary analysis: Report weighted kappa (ordinal scale)
- Sensitivity: Report unweighted kappa for comparison with prior studies
- Interpretation: Use disagreement distance distribution to explain differences
- Primary analysis: Report weighted kappa (ordinal scale)
HER2-Low Context (2023 ASCO/CAP):
- Weighted kappa particularly relevant for HER2 0 vs 1+ distinction (emerging therapeutic importance)
- Adjacent disagreements (e.g., 0 vs 1+) may still affect trastuzumab deruxtecan eligibility
- Weighted kappa particularly relevant for HER2 0 vs 1+ distinction (emerging therapeutic importance)
5.15 Krippendorff’s Alpha
Krippendorff’s alpha is a reliability metric that handles any number of raters, missing data, and different measurement scales. It has been used in several comparable studies (Dy et al. 2024; Abele et al. 2023) and enables direct comparison with published literature.
5.15.1 Calculation
5.15.2 Results Table
| Krippendorff's Alpha: Pre-AI vs Post-AI | ||||||
| Reliability coefficient for multi-rater agreement | ||||||
| Marker | Alpha (Pre-AI) | Alpha (Post-AI) | N (Pre) | N (Post) | Δ Alpha1 | Method2 |
|---|---|---|---|---|---|---|
| ER | 0.938 | 0.943 | 295 | 287 | 0.005 | Ratio |
| PR | 0.824 | 0.867 | 293 | 278 | 0.042 | Ratio |
| Ki67 | 0.849 | 0.843 | 291 | 282 | −0.006 | Ratio |
| HER2 | 0.853 | 0.865 | 229 | 226 | 0.012 | Ordinal |
| 1 Dy et al. (2024): Ki67 alpha 0.63 → 0.89; Abele et al. (2023): Ki67 alpha 0.69 → 0.72 | ||||||
| 2 Ratio method for continuous markers (ER%, PR%, Ki67%); Ordinal method for HER2 scores | ||||||
5.15.3 Interpretation
### Krippendorff's Alpha Interpretation**Benchmarks** (Krippendorff, 2004):- α ≥ 0.80: Acceptable reliability- 0.67 ≤ α < 0.80: Tentative conclusions- α < 0.67: Unacceptable reliability**Literature Comparison:**- Our Ki67 alpha: 0.849 → 0.843 (Δ = -0.006)
- Dy et al. (2024): 0.63 → 0.89 (Δ = 0.26)
- Abele et al. (2023): 0.69 → 0.72 (Δ = 0.03)- Our HER2 alpha: 0.853 → 0.865 (Δ = 0.012)5.15.4 Combined Agreement Metrics Summary
| Combined Agreement Metrics | |||||
| ICC (continuous markers), Fleiss' Kappa (categorical), and Krippendorff's Alpha | |||||
| Phase | Metric | Estimate | 95% CI | Krippendorff's α1 | P (Pre vs Post)2 |
|---|---|---|---|---|---|
| ER | |||||
| Pre-AI | ICC | 0.962 | 0.948 – 0.972 | 0.938 | — |
| Post-AI | ICC | 0.980 | 0.973 – 0.985 | 0.943 | 0.009 |
| PR | |||||
| Pre-AI | ICC | 0.952 | 0.943 – 0.960 | 0.824 | — |
| Post-AI | ICC | 0.974 | 0.968 – 0.978 | 0.867 | <0.001 |
| Ki67 | |||||
| Pre-AI | ICC | 0.939 | 0.919 – 0.954 | 0.849 | — |
| Post-AI | ICC | 0.937 | 0.924 – 0.948 | 0.843 | 0.854 |
| HER2 | |||||
| Pre-AI | Fleiss Kappa | 0.671 | — | 0.853 | — |
| Post-AI | Fleiss Kappa | 0.726 | — | 0.865 | 0.004 |
| Molecular Subtype | |||||
| Pre-AI | Fleiss Kappa | 0.799 | — | — | — |
| Post-AI | Fleiss Kappa | 0.800 | — | — | 0.458 |
| 1 Krippendorff's α: ratio method for continuous markers, ordinal method for HER2. Not available for Molecular Subtype. | |||||
| 2 P-values: ICC uses z-test on Fisher-transformed values; Kappa uses bootstrap (2000 resamples). Shown only on Post-AI row. | |||||