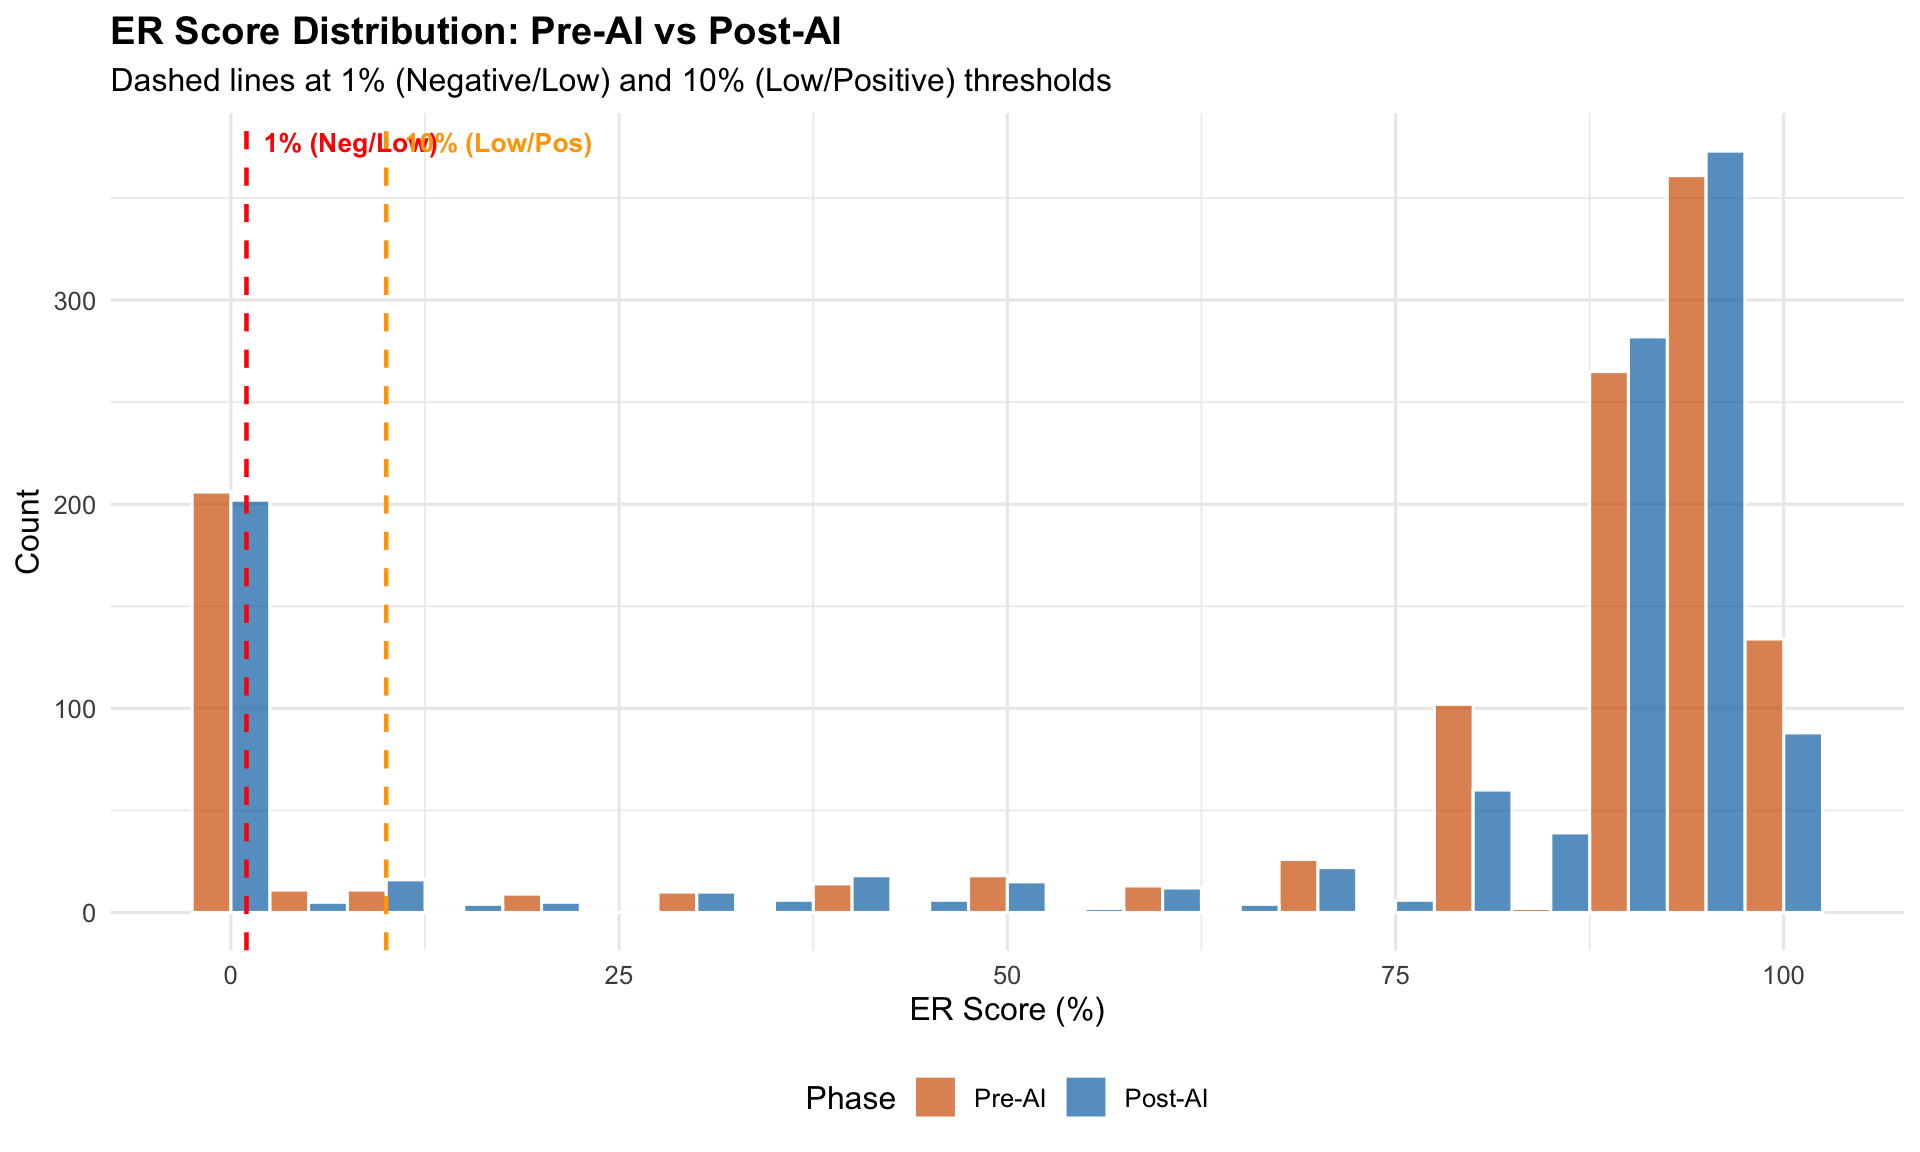
ER continuous observations: 2368 Cases: 296 Pathologists: 4 Merged data rows: 1184 The estrogen receptor (ER) is one of the most critical biomarkers in breast cancer, directly determining endocrine therapy eligibility. While most breast cancers show either clearly negative (0%) or clearly positive (>10%) ER expression, the ER-low positive (1-9%) range represents a clinically controversial category.
The 2020 ASCO/CAP update reclassified ER expression into three categories:
| Category | ER% Range | Clinical Designation | Endocrine Therapy |
|---|---|---|---|
| Negative | <1% | ER-negative | Not indicated |
| Low Positive | 1-9% | ER-low positive | Consider (controversial) |
| Positive | >=10% | ER-positive | Standard of care |
Key clinical issue: The ER 1-9% (low positive) category:
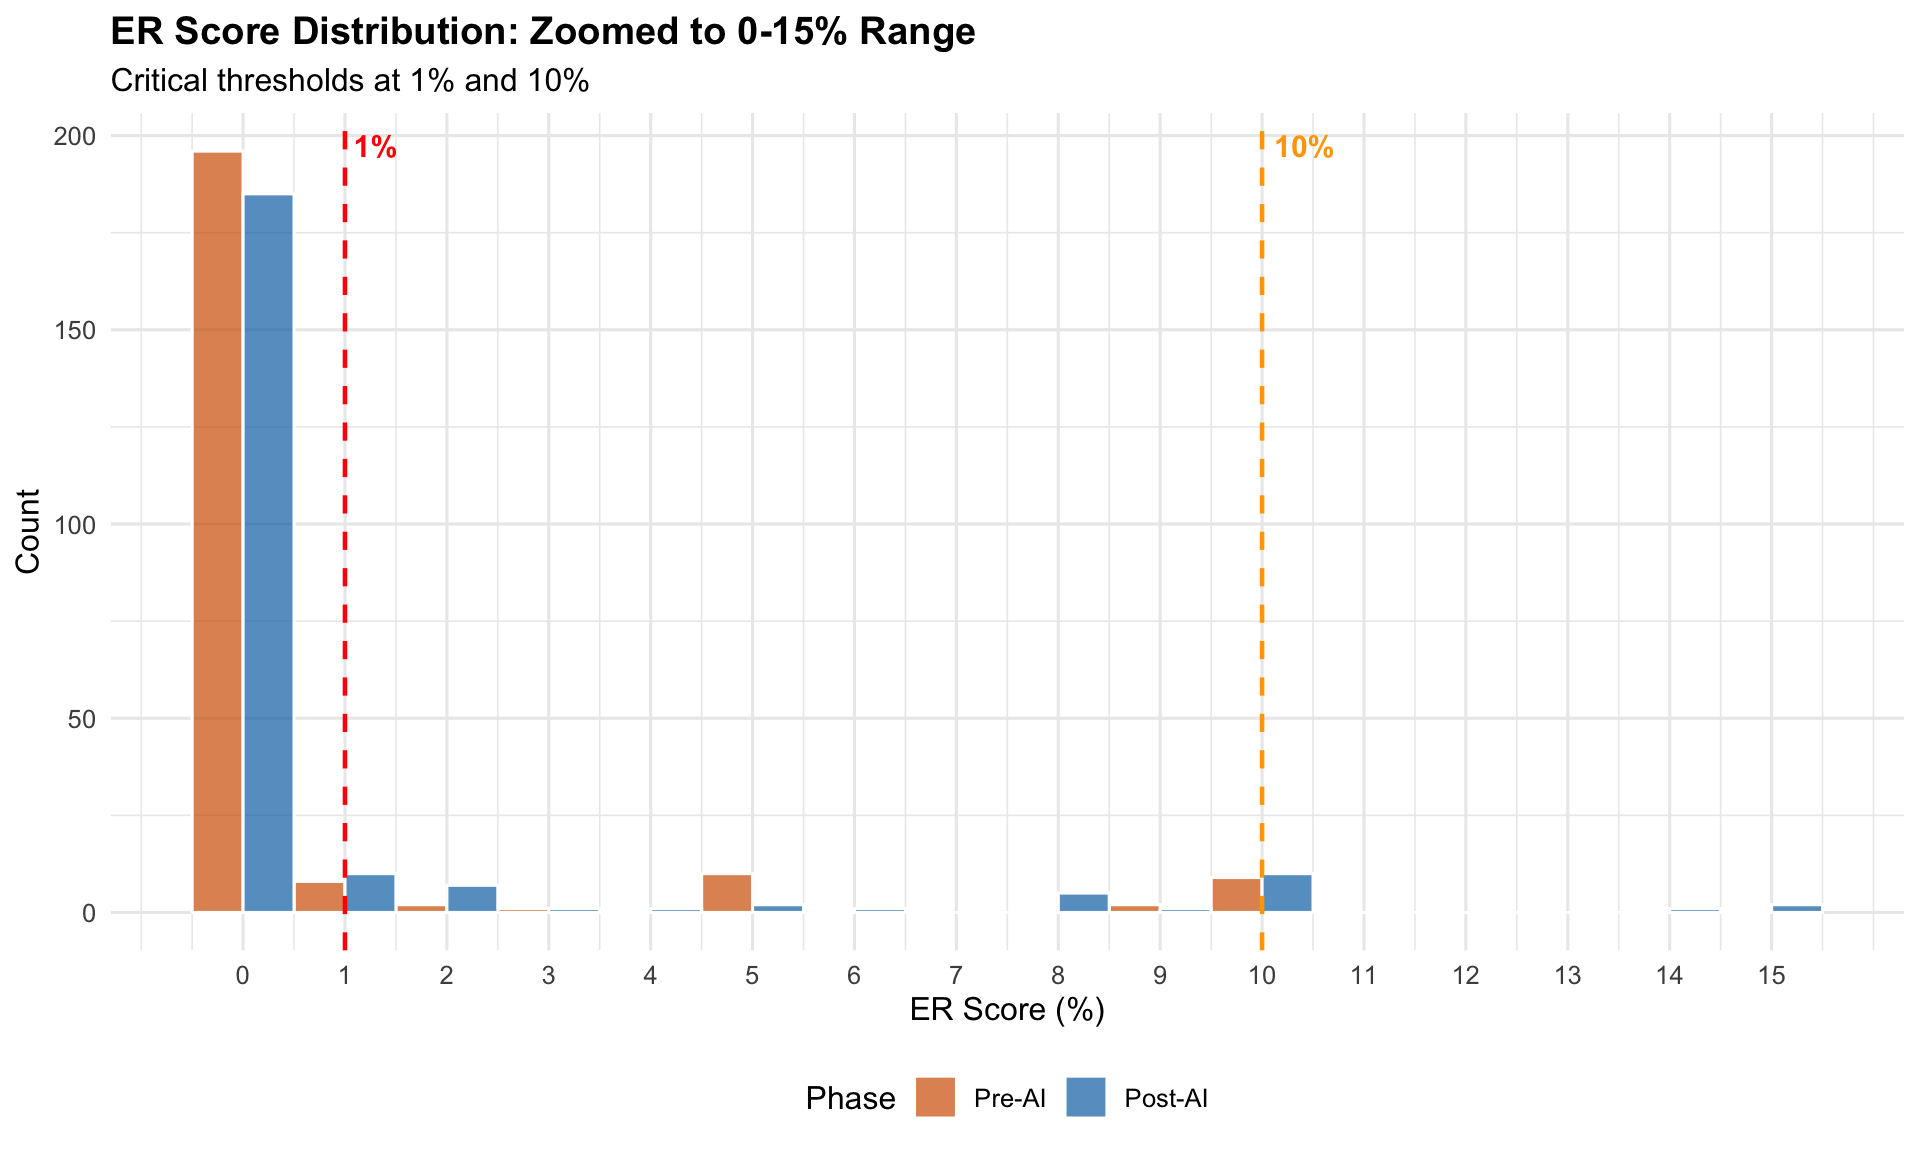
Note for Pathologist: At low ER levels (0-10%), visual estimation is most subjective and interobserver variability highest. AI may systematically shift scores in this range. This analysis examines whether AI assistance improves or worsens agreement at these clinically critical thresholds.
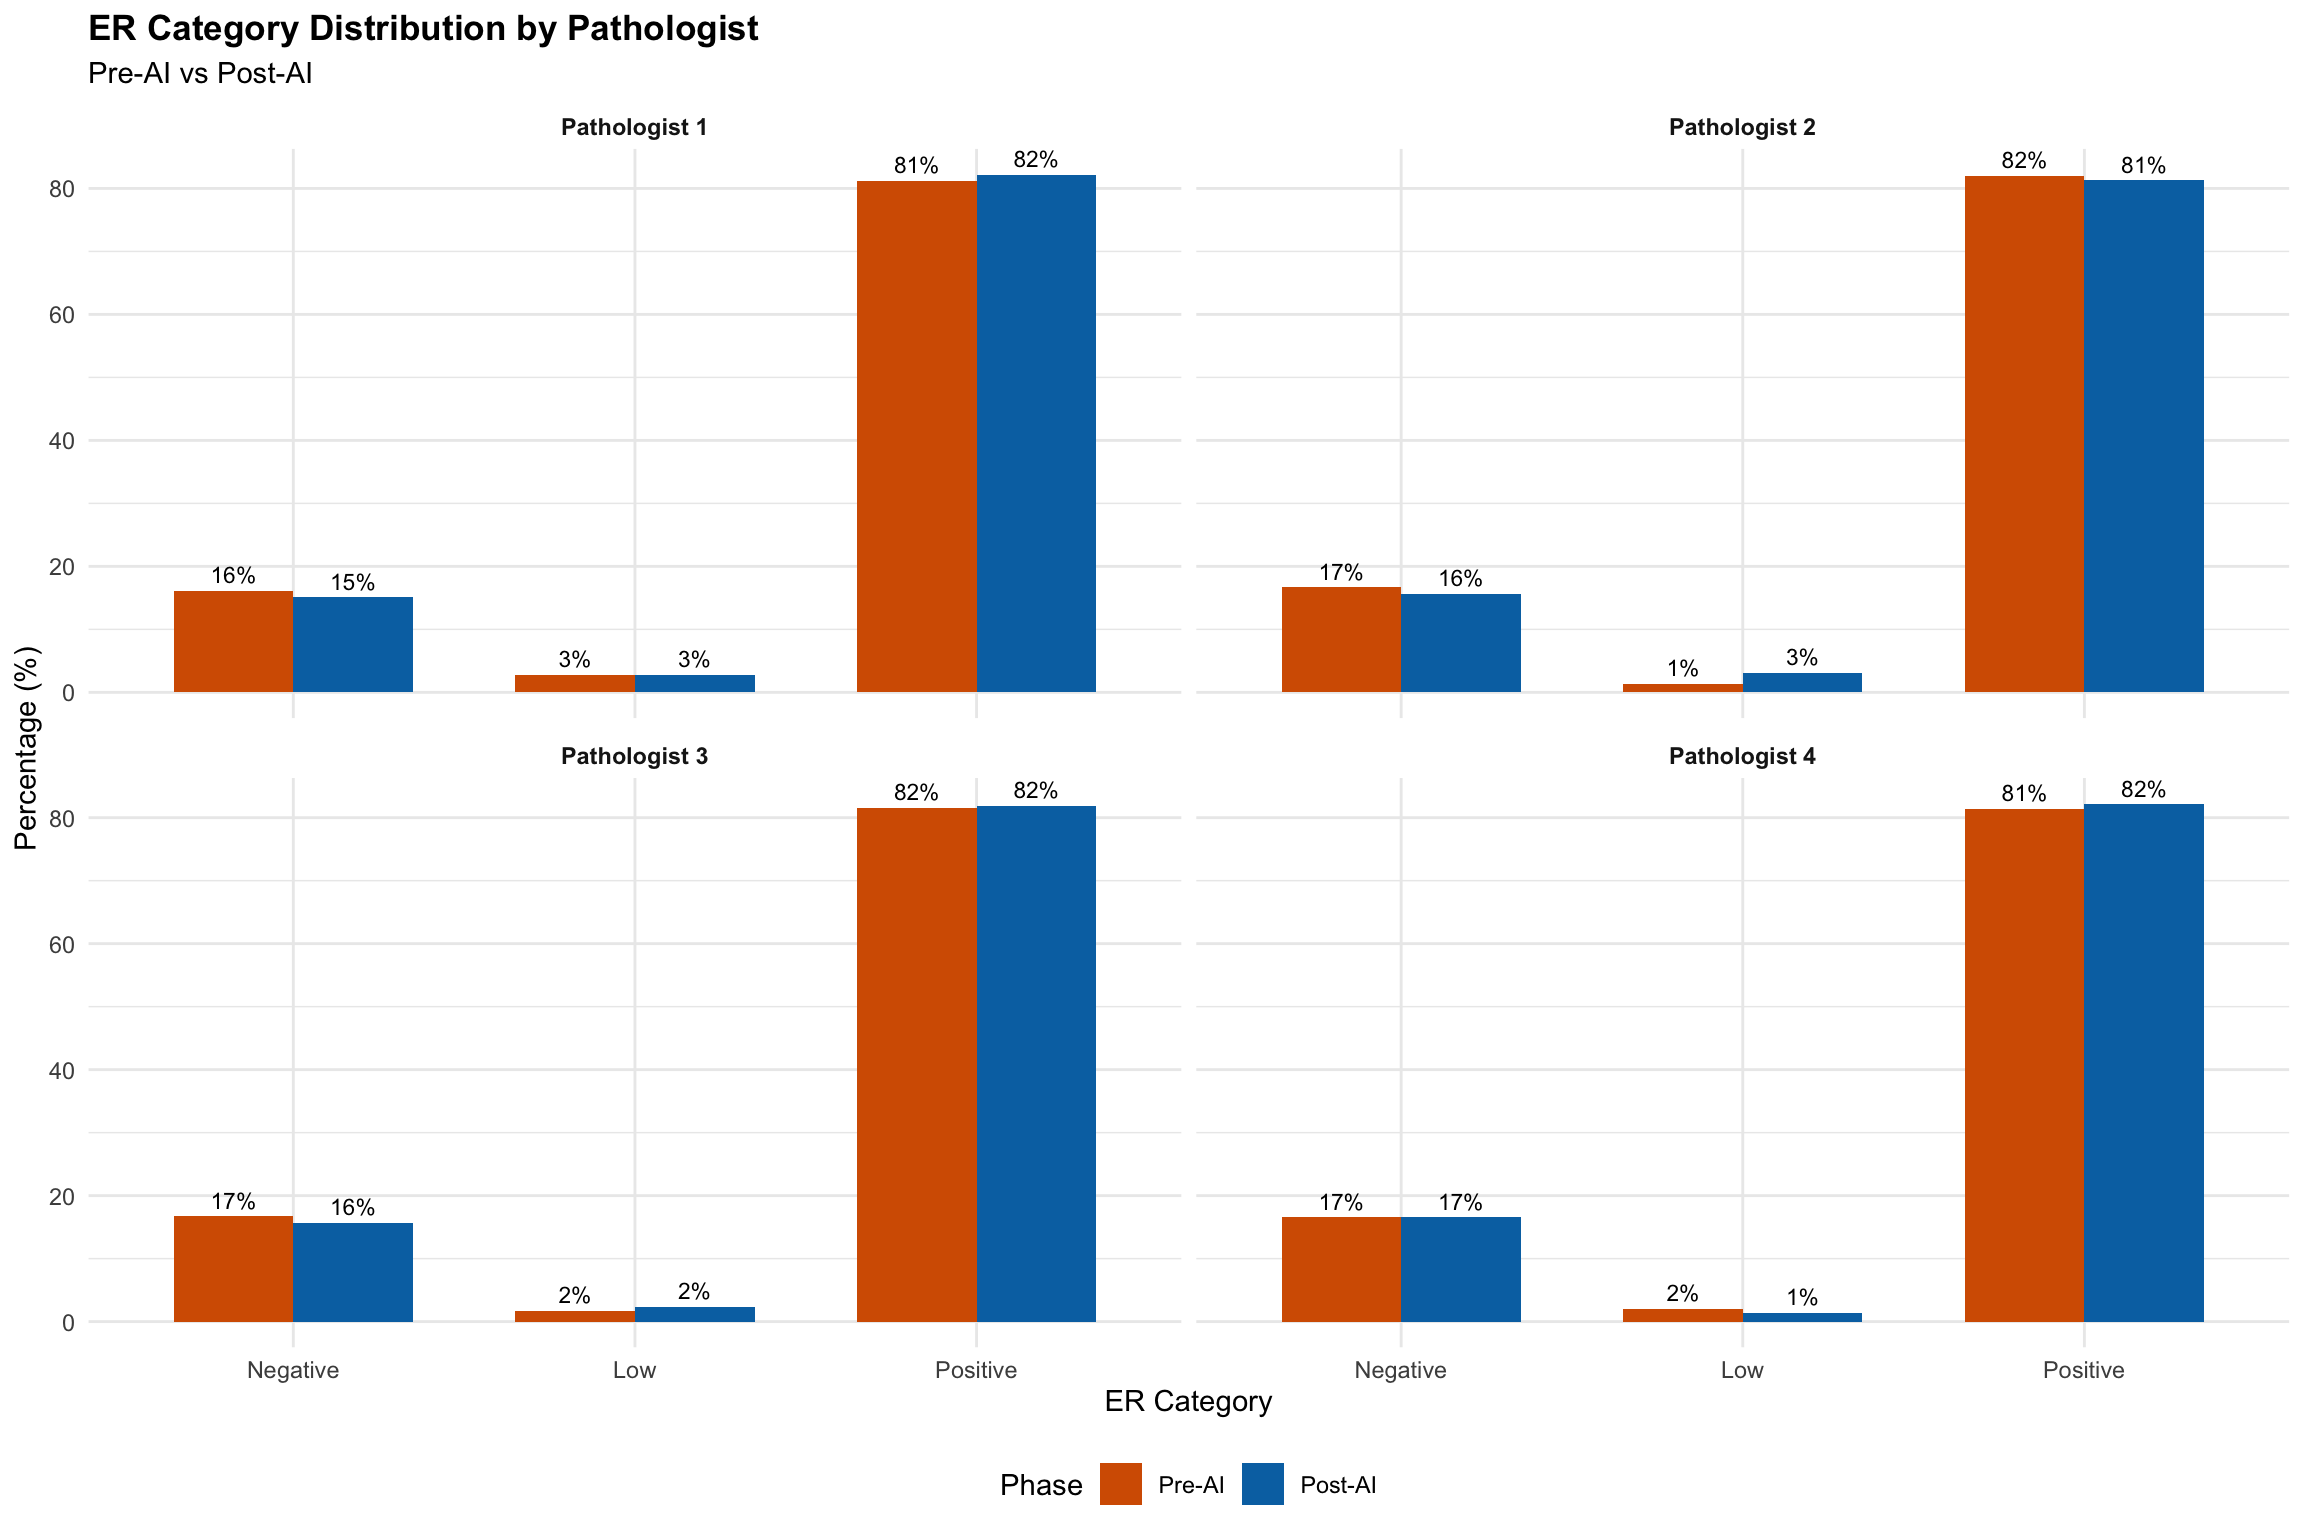
ER continuous observations: 2368 Cases: 296 Pathologists: 4 Merged data rows: 1184 | ER Category Distribution | ||||
| Pre-AI vs Post-AI Assessment (Negative <1%, Low 1-9%, Positive >=10%) | ||||
| Phase | ER Category1 | N | Total | Percentage |
|---|---|---|---|---|
| Pre-AI | Negative | 194 | 1175 | 16.5 |
| Pre-AI | Low | 23 | 1175 | 2.0 |
| Pre-AI | Positive | 958 | 1175 | 81.5 |
| Post-AI | Negative | 185 | 1175 | 15.7 |
| Post-AI | Low | 28 | 1175 | 2.4 |
| Post-AI | Positive | 962 | 1175 | 81.9 |
| 1 Low positive (1-9%) highlighted — controversial category per ASCO/CAP 2020 | ||||
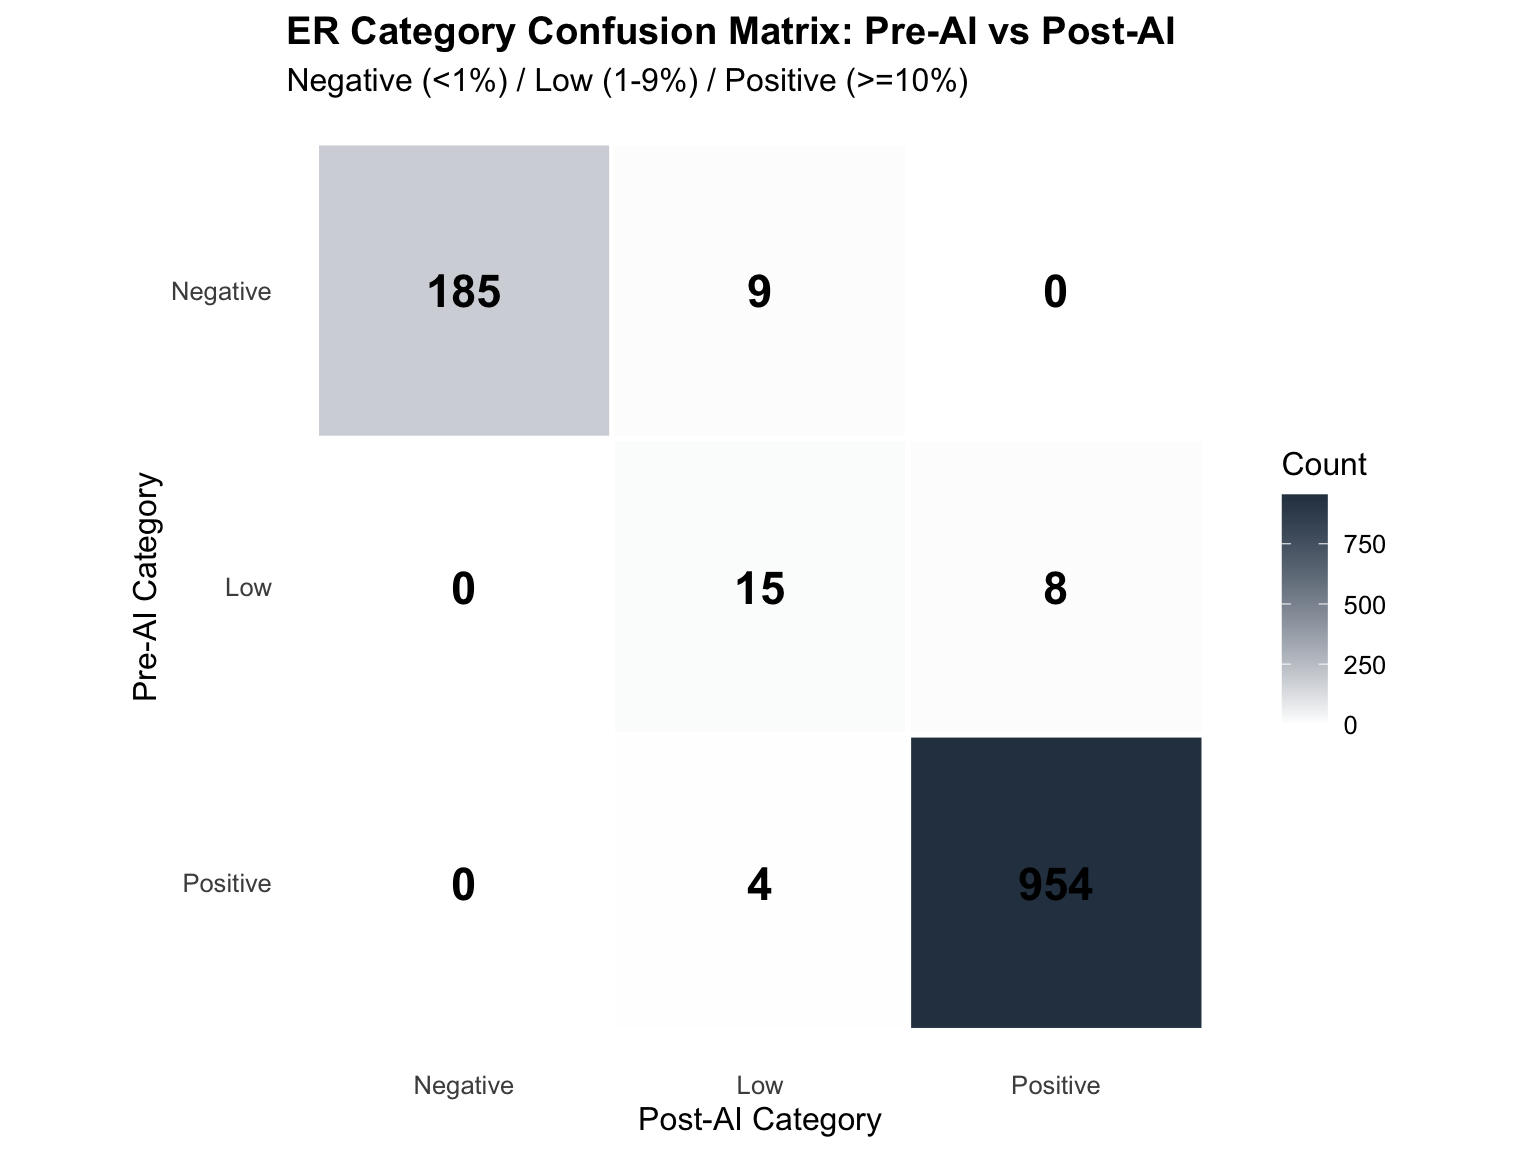
| ER Category Transition Matrix1 | |||
| Pre-AI (rows) to Post-AI (columns)1 | |||
| Pre-AI Category |
Post-AI Category
|
||
|---|---|---|---|
| Negative | Low | Positive | |
| Negative | 185 | 9 | 0 |
| Low | 0 | 15 | 8 |
| Positive | 0 | 4 | 954 |
| 1 Diagonal = consistent classification; off-diagonal = reclassification | |||
| ER Category Transition Matrix (Row Percentages) | |||
| Pre-AI (rows) to Post-AI (columns) — row % shown | |||
| Pre-AI Category |
Post-AI Category
|
||
|---|---|---|---|
| Negative | Low | Positive | |
| Negative | 185 (95.4%) | 9 (4.6%) | 0 (0.0%) |
| Low | 0 (0.0%) | 15 (65.2%) | 8 (34.8%) |
| Positive | 0 (0.0%) | 4 (0.4%) | 954 (99.6%) |
| ER Category Transitions by Clinical Impact | ||
| Treatment-relevant reclassifications highlighted | ||
| Transition Type | N Cases | Percentage |
|---|---|---|
| No change | 1154 | 98.2 |
| Negative -> Low (Gained endocrine eligibility) | 9 | 0.8 |
| Low -> Positive (Clear endocrine benefit) | 8 | 0.7 |
| Positive -> Low (Uncertain benefit) | 4 | 0.3 |
Clinical Interpretation:
KEY FINDINGS - ER Category Transitions:

1% THRESHOLD CROSSINGS (Negative <-> Low):
- 9 cases (0.8%) Negative -> Low: GAINED endocrine therapy eligibility
- 0 cases (0%) Low -> Negative: LOST endocrine therapy eligibility
- Net: 9 additional cases eligible for endocrine therapy

10% THRESHOLD CROSSINGS (Low <-> Positive):
- 8 cases (0.7%) Low -> Positive: Moved to clear endocrine benefit
- 4 cases (0.3%) Positive -> Low: Moved to uncertain benefit range

MAJOR CHANGES (Negative <-> Positive):
- 0 cases (0%) Negative -> Positive
- 0 cases (0%) Positive -> Negative

Total reclassified: 21 out of 1175 (1.8%)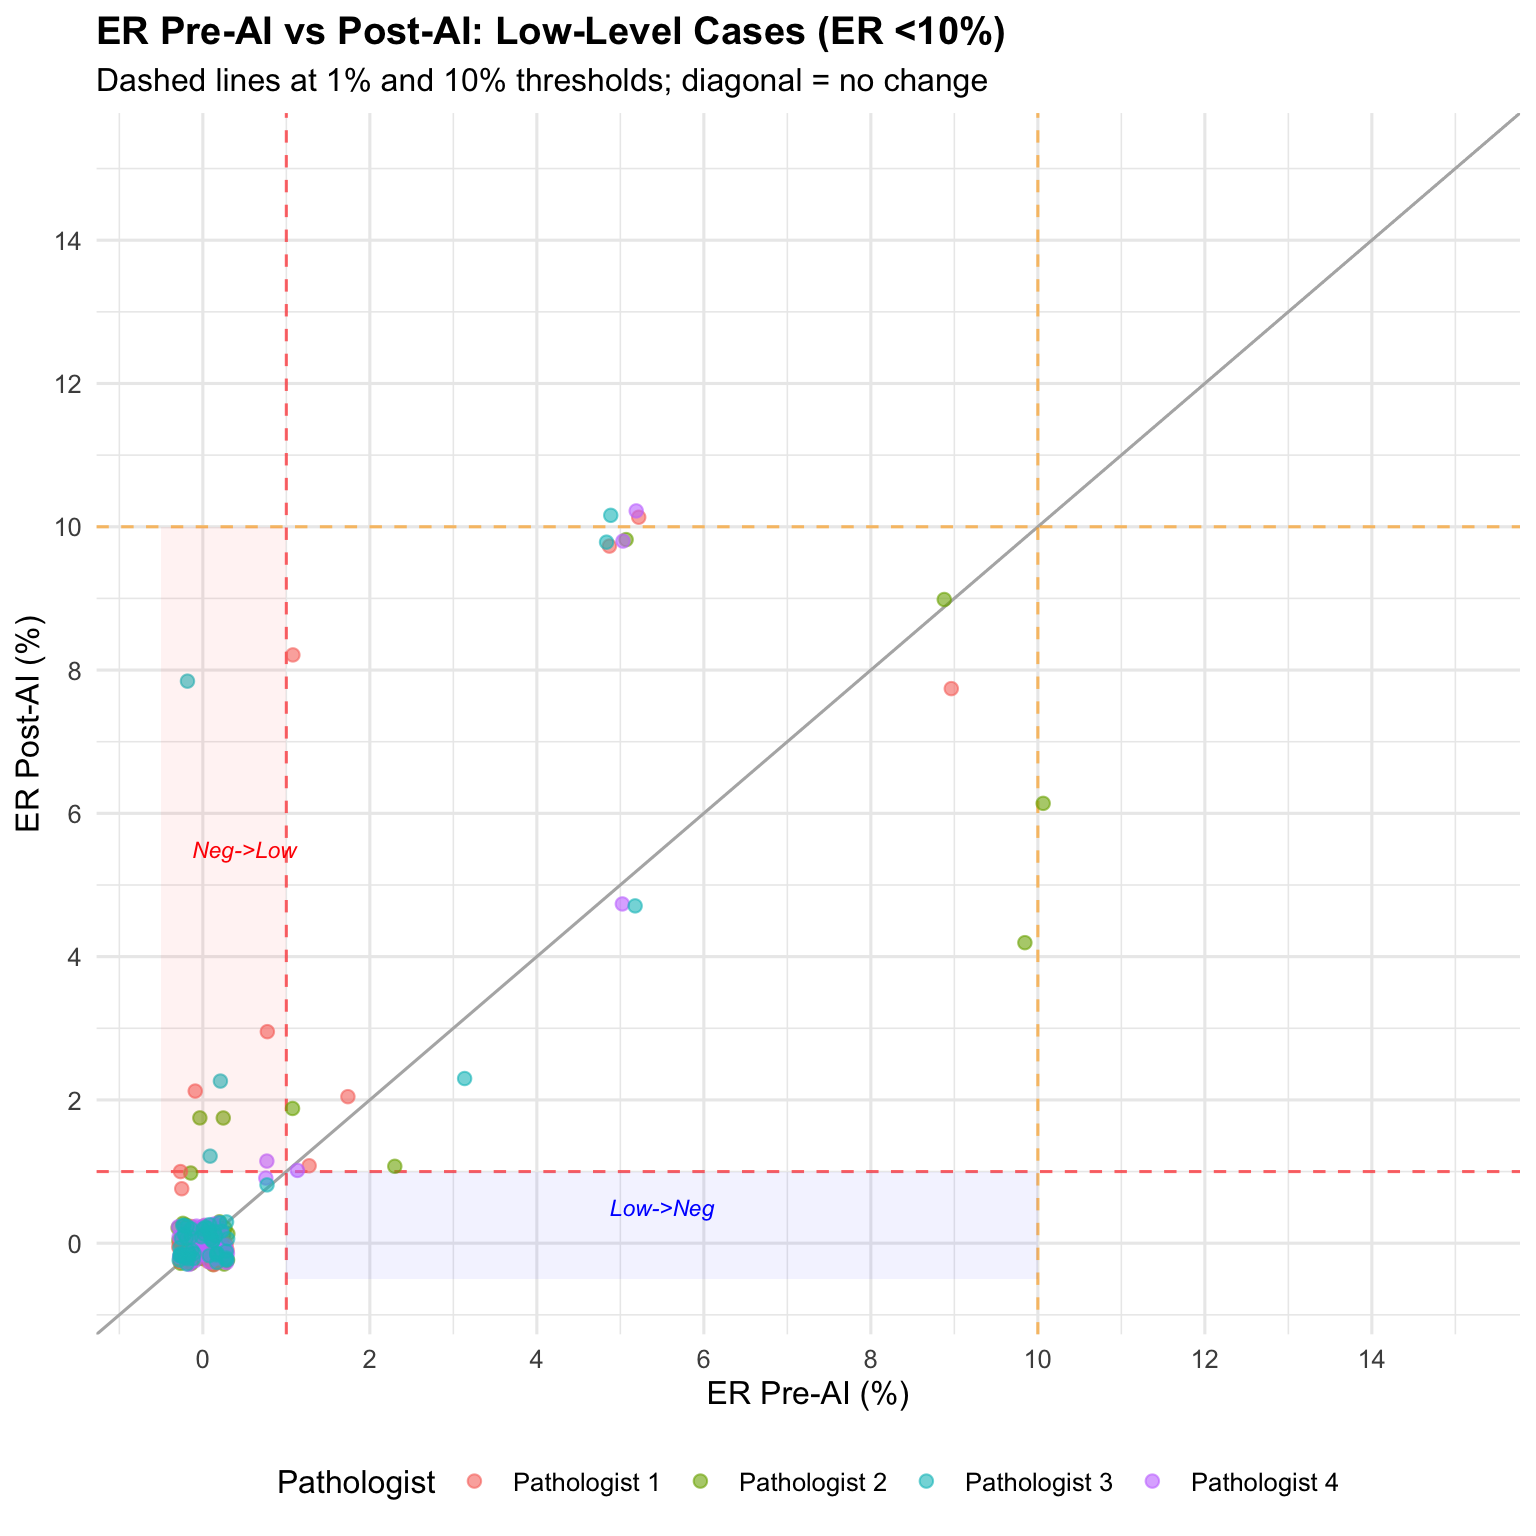
| Cases Crossing the 1% Threshold | |||||
| ER-Negative <-> ER-Low Positive transitions | |||||
| Case ID | Pathologist | ER Pre-AI (%) | ER Post-AI (%) | Direction | Biopsy Type |
|---|---|---|---|---|---|
| 23175-25 | Pathologist 2 | 0.0 | 2.0 | Gained positivity (Neg->Low) | Excision |
| 21524-25 | Pathologist 2 | 0.0 | 1.0 | Gained positivity (Neg->Low) | Excision |
| 18689-25 | Pathologist 2 | 0.0 | 2.0 | Gained positivity (Neg->Low) | Tru-cut |
| 19713-25 | Pathologist 1 | 0.0 | 1.0 | Gained positivity (Neg->Low) | Tru-cut |
| 18689-25 | Pathologist 1 | 0.0 | 1.0 | Gained positivity (Neg->Low) | Tru-cut |
| 11985-25 | Pathologist 1 | 0.0 | 2.0 | Gained positivity (Neg->Low) | Excision |
| 19266-25 | Pathologist 3 | 0.0 | 8.0 | Gained positivity (Neg->Low) | Excision |
| 18961-25 | Pathologist 3 | 0.0 | 1.0 | Gained positivity (Neg->Low) | Excision |
| 14324-25 | Pathologist 3 | 0.0 | 2.0 | Gained positivity (Neg->Low) | Tru-cut |
| Cases Crossing the 10% Threshold | |||||
| ER-Low <-> ER-Positive transitions | |||||
| Case ID | Pathologist | ER Pre-AI (%) | ER Post-AI (%) | Direction | Biopsy Type |
|---|---|---|---|---|---|
| 14058-25 | Pathologist 2 | 5.0 | 10.0 | Low -> Positive | Tru-cut |
| 32963-25 | Pathologist 1 | 5.0 | 10.0 | Low -> Positive | Tru-cut |
| 14982-25 | Pathologist 1 | 5.0 | 16.0 | Low -> Positive | Excision |
| 14058-25 | Pathologist 1 | 5.0 | 10.0 | Low -> Positive | Tru-cut |
| 29841-25 | Pathologist 4 | 5.0 | 10.0 | Low -> Positive | Excision |
| 20256-25 | Pathologist 4 | 5.0 | 10.0 | Low -> Positive | Tru-cut |
| 29841-25 | Pathologist 3 | 5.0 | 10.0 | Low -> Positive | Excision |
| 14058-25 | Pathologist 3 | 5.0 | 10.0 | Low -> Positive | Tru-cut |
| 32973-25 | Pathologist 2 | 10.0 | 6.0 | Positive -> Low | Excision |
| 18961-25 | Pathologist 2 | 10.0 | 4.0 | Positive -> Low | Excision |
| 20256-25 | Pathologist 3 | 20.0 | 8.0 | Positive -> Low | Tru-cut |
| 20256-25 | Pathologist 2 | 40.0 | 8.0 | Positive -> Low | Tru-cut |
| ER Category Agreement (3-category: Negative / Low / Positive) | |||||
| Fleiss' Kappa for all 4 pathologists | |||||
| Phase | Fleiss' Kappa | z-statistic | p-value | N Cases | Delta Kappa |
|---|---|---|---|---|---|
| Pre-AI | 0.938 | 43.201 | 0.00 | 295 | NA |
| Post-AI | 0.941 | 43.735 | 0.00 | 287 | 0.003 |
| Binary Agreement at Key ER Thresholds | |||||
| Fleiss' Kappa for binary classifications | |||||
| Threshold | Phase | Fleiss' Kappa | z | p-value | N Cases |
|---|---|---|---|---|---|
| 1% (Neg vs Non-Neg) | Pre-AI | 0.967 | 40.699 | 0.00 | 295 |
| 1% (Neg vs Non-Neg) | Post-AI | 0.945 | 39.208 | 0.00 | 287 |
| 10% (Low vs Positive) | Pre-AI | 0.660 | 25.308 | 0.00 | 245 |
| 10% (Low vs Positive) | Post-AI | 0.873 | 33.054 | 0.00 | 239 |
| Pairwise Cohen's Kappa for ER Categories | |||
| 3-category (Negative/Low/Positive) per pathologist pair | |||
| Pathologist Pair | Pre-AI Kappa | Post-AI Kappa | Delta |
|---|---|---|---|
| Pathologist 2 vs Pathologist 1 | NA | NA | NA |
| Pathologist 2 vs Pathologist 4 | NA | NA | NA |
| Pathologist 2 vs Pathologist 3 | NA | NA | NA |
| Pathologist 1 vs Pathologist 4 | NA | NA | NA |
| Pathologist 1 vs Pathologist 3 | NA | NA | NA |
| Pathologist 4 vs Pathologist 3 | NA | NA | NA |
| ER Category Confusion Matrix: Pre-AI vs Post-AI | |||
| Pre-AI as reference, Post-AI as prediction | |||
| Reference (Pre-AI) |
Post-AI (Prediction)
|
||
|---|---|---|---|
| Negative | Low | Positive | |
| Negative | 185 | 9 | 0 |
| Low | 0 | 15 | 8 |
| Positive | 0 | 4 | 954 |
| Precision, Recall, and F1: ER 3-Category Classification | |||||||
| Pre-AI as reference standard | |||||||
| Category | TP | FP | FN | Precision | Recall | F1 | Accuracy |
|---|---|---|---|---|---|---|---|
| Negative | 185 | 0 | 9 | 1.000 | 0.954 | 0.976 | 0.982 |
| Low1 | 15 | 13 | 8 | 0.536 | 0.652 | 0.588 | 0.982 |
| Positive | 954 | 8 | 4 | 0.992 | 0.996 | 0.994 | 0.982 |
| 1 Low category (1-9%) highlighted — typically hardest to classify consistently | |||||||
| Per-Pathologist Precision/Recall/F1 for ER Categories | |||||
| Pre-AI as reference, Post-AI as prediction | |||||
| Pathologist | Category | Precision | Recall | F1 | Accuracy |
|---|---|---|---|---|---|
| Pathologist 1 | Negative | 1.000 | 0.936 | 0.967 | 0.979 |
| Pathologist 1 | Low | 0.625 | 0.625 | 0.625 | 0.979 |
| Pathologist 1 | Positive | 0.988 | 1.000 | 0.994 | 0.979 |
| Pathologist 2 | Negative | 1.000 | 0.939 | 0.968 | 0.976 |
| Pathologist 2 | Low | 0.333 | 0.750 | 0.462 | 0.976 |
| Pathologist 2 | Positive | 0.996 | 0.988 | 0.992 | 0.976 |
| Pathologist 3 | Negative | 1.000 | 0.939 | 0.968 | 0.980 |
| Pathologist 3 | Low | 0.429 | 0.600 | 0.500 | 0.980 |
| Pathologist 3 | Positive | 0.992 | 0.996 | 0.994 | 0.980 |
| Pathologist 4 | Negative | 1.000 | 1.000 | 1.000 | 0.993 |
| Pathologist 4 | Low | 1.000 | 0.667 | 0.800 | 0.993 |
| Pathologist 4 | Positive | 0.992 | 1.000 | 0.996 | 0.993 |
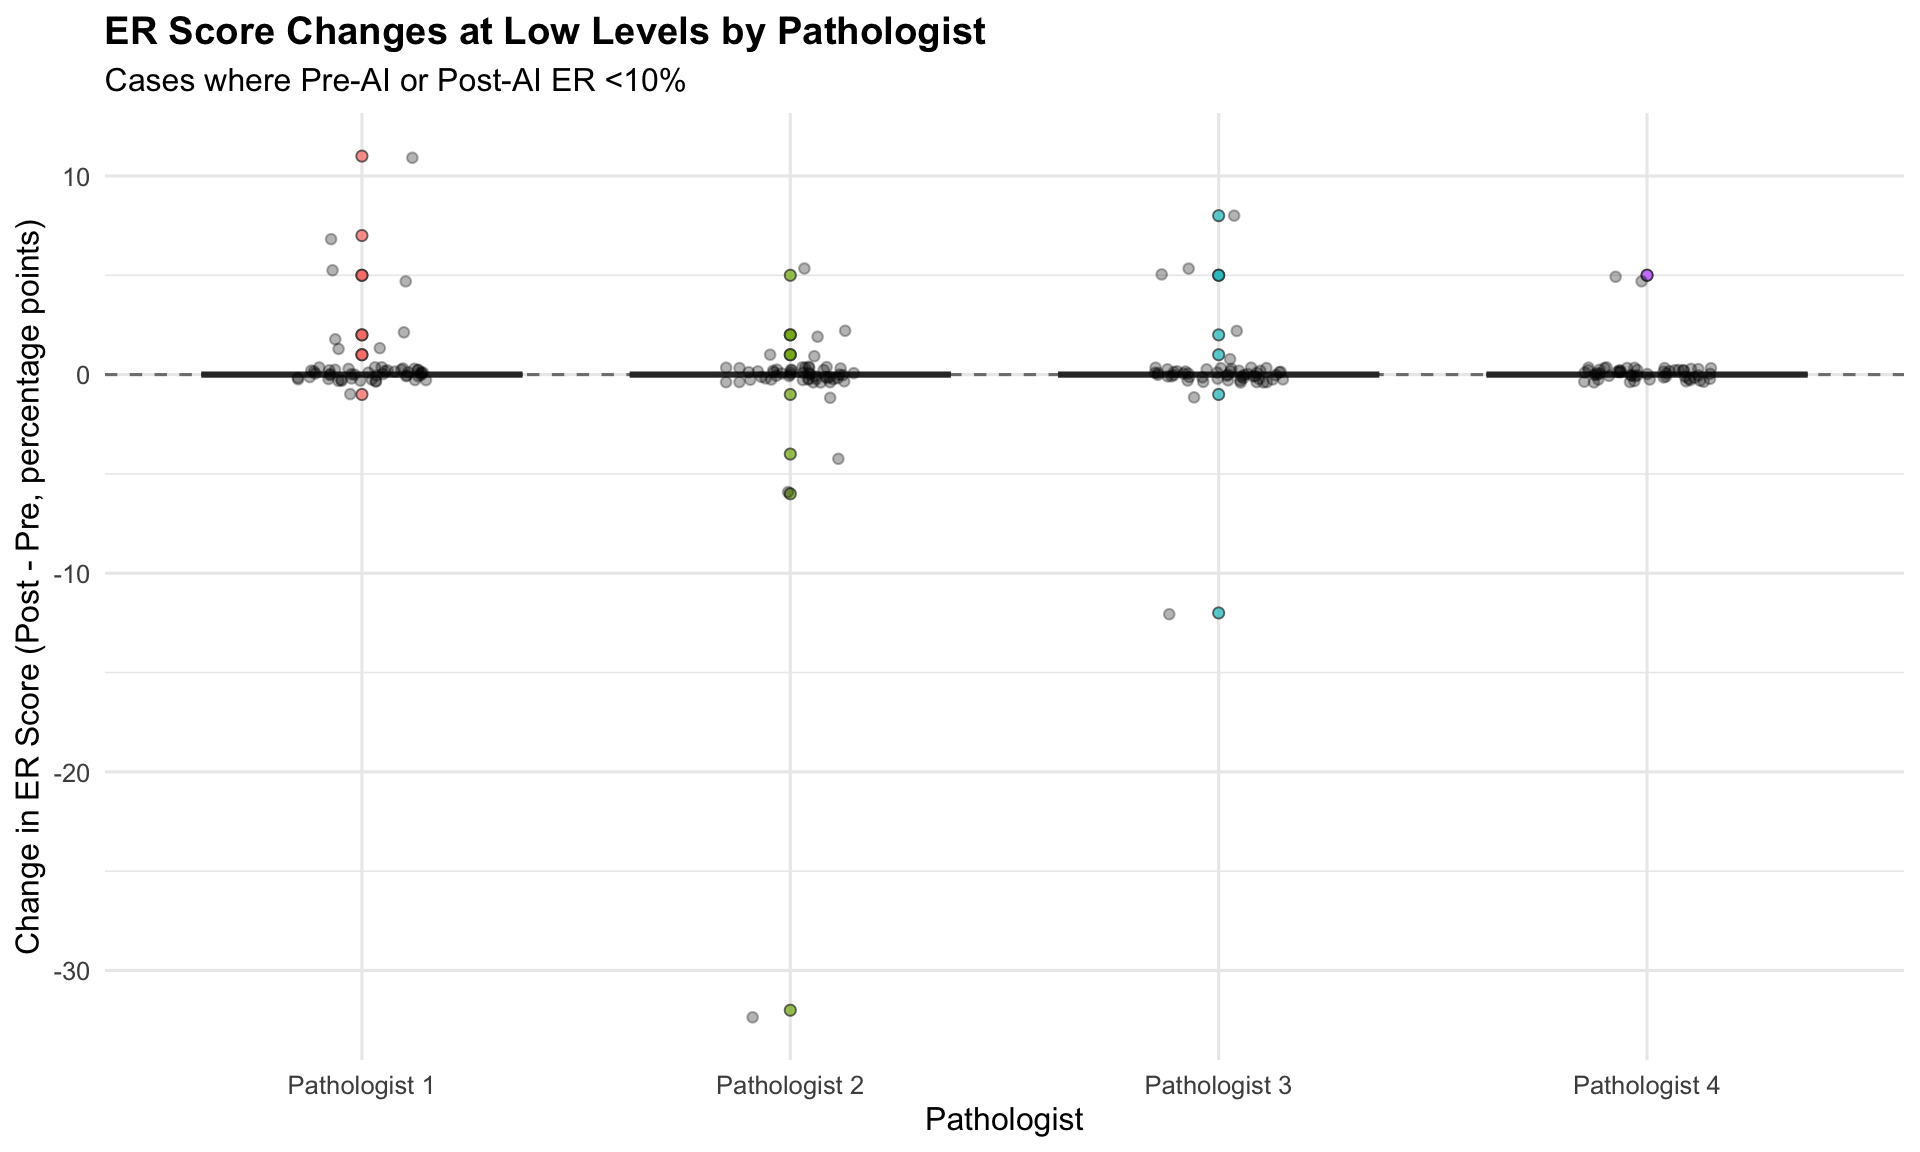
| Per-Pathologist ER Changes at Low Levels (<10%) | ||||||||||
| Direction and magnitude of AI-associated changes | ||||||||||
| Pathologist | N Low Cases | Mean Change | Median Change | N Upward | N Downward | N No Change | % Upward | % Downward | Crossed 1% | Crossed 10% |
|---|---|---|---|---|---|---|---|---|---|---|
| Pathologist 1 | 56 | 0.6 | 0.0 | 8 | 1 | 47 | 14.3 | 1.8 | NA | NA |
| Pathologist 2 | 56 | −0.6 | 0.0 | 5 | 4 | 47 | 8.9 | 7.1 | 3 | 4 |
| Pathologist 3 | 56 | 0.1 | 0.0 | 5 | 2 | 49 | 8.9 | 3.6 | NA | NA |
| Pathologist 4 | 55 | 0.2 | 0.0 | 2 | 0 | 53 | 3.6 | 0.0 | 0 | 2 |
| ER Category Concordance Rate per Pathologist | |||
| Pre-AI vs Post-AI agreement on 3-category classification | |||
| Pathologist | N Cases | N Concordant | Concordance (%) |
|---|---|---|---|
| Pathologist 1 | 292 | 286 | 97.9 |
| Pathologist 2 | 294 | 287 | 97.6 |
| Pathologist 3 | 293 | 287 | 98.0 |
| Pathologist 4 | 296 | 294 | 99.3 |
| ER Category Transitions by Biopsy Type | |||
| Does specimen type affect reclassification at low ER levels? | |||
| Biopsy Type | Low -> Pos | Neg -> Low | Pos -> Low |
|---|---|---|---|
| Excision | 3 | 5 | 2 |
| Tru-cut | 5 | 4 | 2 |
| ER Reclassification Rate by Biopsy Type | |||||
| Overall and 1% threshold crossings | |||||
| Biopsy Type | N Total | N Reclassified | Reclass Rate (%) | Crossed 1% | % Crossed 1% |
|---|---|---|---|---|---|
| Excision | 692 | 10 | 1.4 | 5 | 0.7 |
| Tru-cut | 483 | 11 | 2.3 | 4 | 0.8 |
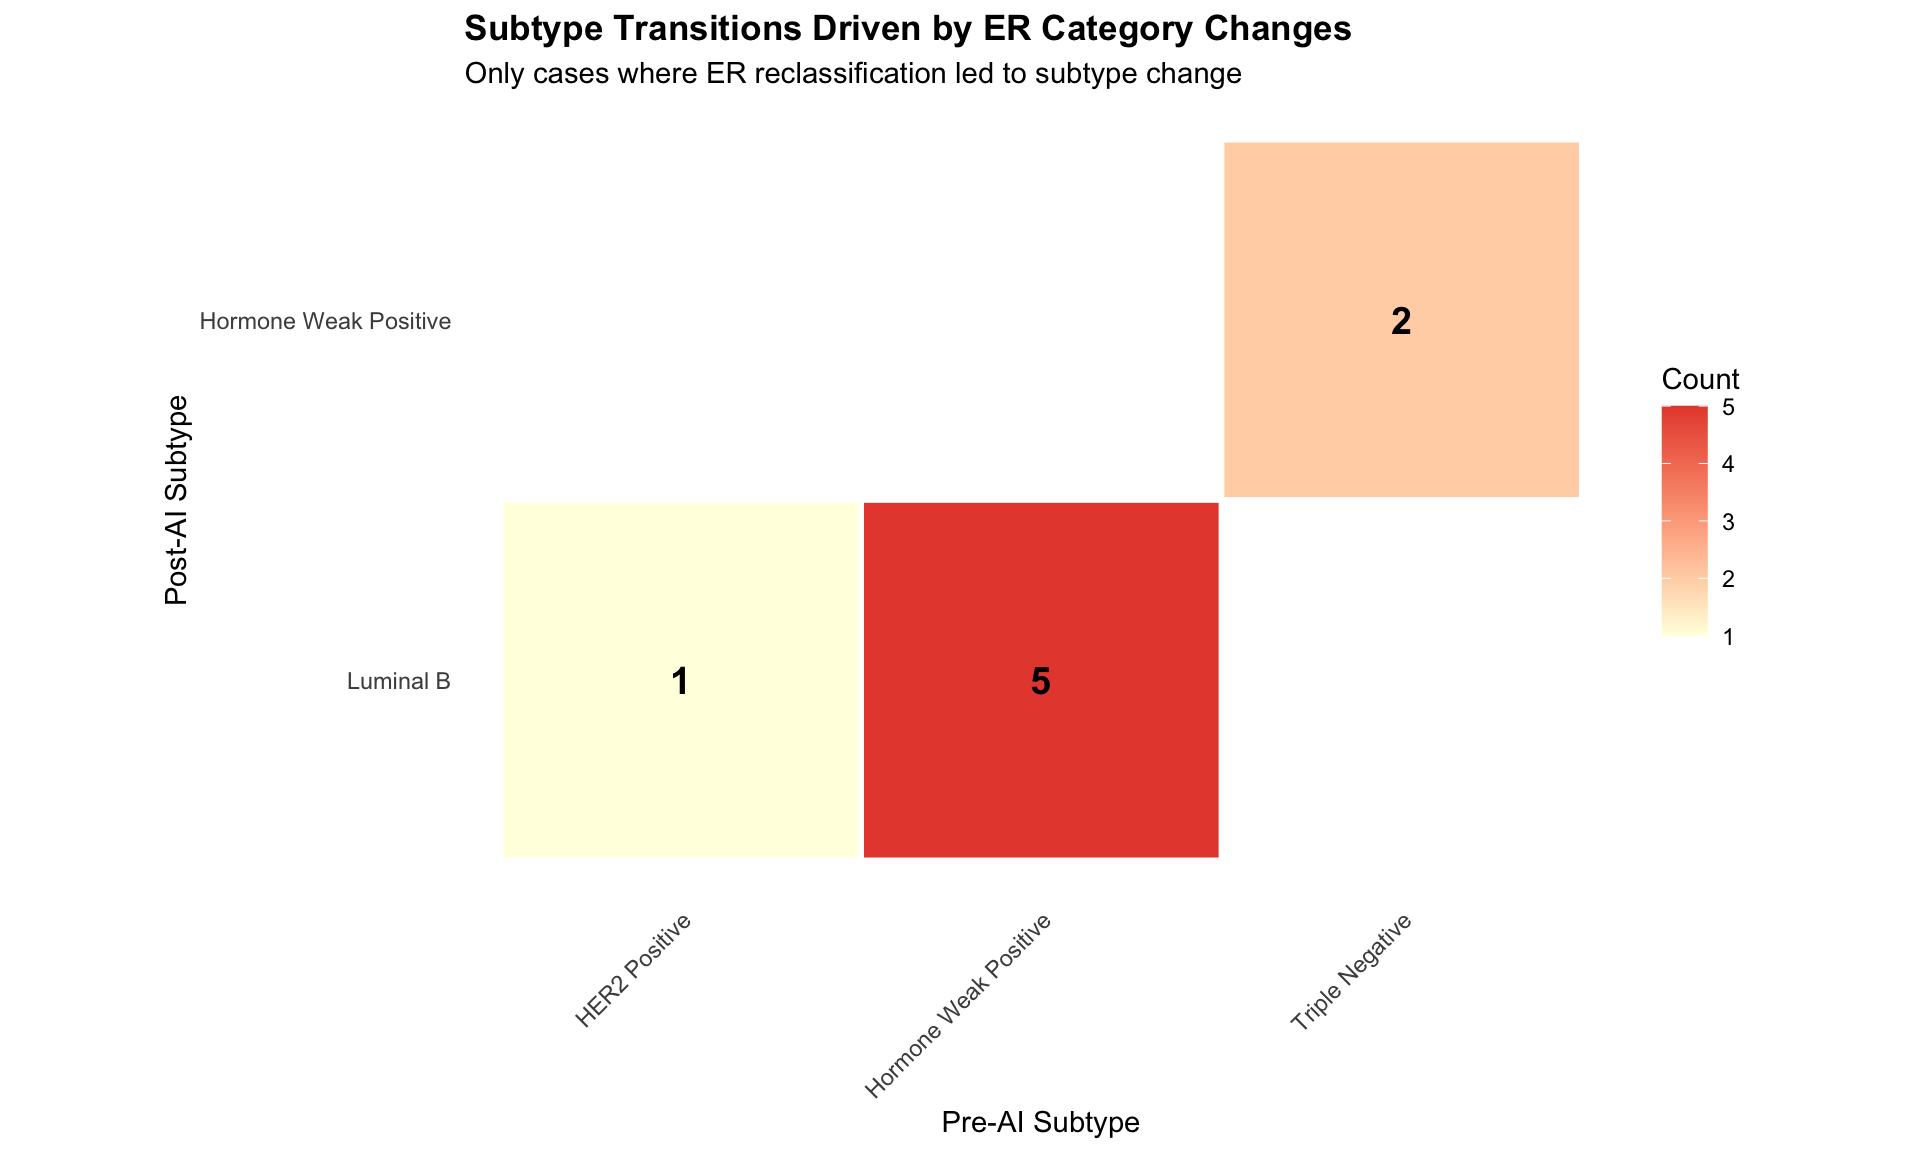
| ER Reclassification Impact on Molecular Subtype | |||
| How often does an ER category change cascade into subtype reclassification? | |||
| ER Transition | N ER Reclassified | N Subtype Changed | % Subtype Changed |
|---|---|---|---|
| Negative -> Low | 9 | 2 | 22.2 |
| Low -> Positive | 8 | 6 | 75.0 |
| Positive -> Low | 4 | 0 | 0.0 |
| Triple-Negative <-> HR-Positive Transitions Driven by ER Change | |||||
| Cases where ER reclassification caused triple-negative status change | |||||
| Case ID | Pathologist | ER Pre-AI | ER Post-AI | Subtype Pre-AI | Subtype Post-AI |
|---|---|---|---|---|---|
| 21524-25 | Pathologist 2 | Negative | Low | Triple Negative | Hormone Weak Positive |
| 11985-25 | Pathologist 1 | Negative | Low | Triple Negative | Hormone Weak Positive |
SUMMARY - ER Low-Level Interpretation Analysis
================================================

SAMPLE:
- Total paired assessments: 1175
- Reclassified: 21 (1.8%)
- Unchanged: 1154 (98.2%)

1% THRESHOLD (Negative <-> Low):
- Negative -> Low: 9 (gained endocrine eligibility)
- Low -> Negative: 0 (lost endocrine eligibility)
- Net change at 1%: 9 cases

10% THRESHOLD (Low <-> Positive):
- Low -> Positive: 8 (moved to clear benefit)
- Positive -> Low: 4 (moved to uncertain benefit)

AGREEMENT:
- 3-category Fleiss' Kappa: 0.938 (Pre-AI) -> 0.941 (Post-AI), Delta = 0.0031. ER 1% Threshold Monitoring
2. ER Low Positive (1-9%) Reporting
3. Quality Assurance
4. Future Directions
Analysis completed: 2026-02-10
ER low-level interpretation is clinically critical for endocrine therapy decisions
AI provides assistance but expert judgment remains essential at low ER levels