Objective
Analyze how AI assistance changes the interpretation of individual pathologists and if it leads to consensus.
Note for Pathologist: This analysis focuses on the “Impact of AI” on your individual assessments. We perform a “Non-inferiority Analysis” to ensure AI doesn’t negatively disrupt standard scoring (benchmark >75% agreement). We also visualize “Score Shifting” (did AI make you grade higher or lower?) and “Variance Reduction” (did AI make the group of pathologists agree more with each other?).
Molecular Classification Definitions
- HER2 Positive: HER2 Score 2 or 3.
- Luminal A: HER2 (0/1) & ER > 10% & PR > 10% & Ki67 < 30%.
- Luminal B: HER2 (0/1) & ER > 10% & Ki67 >= 30%.
- Hormone Weak Positive: HER2 (0/1) & (ER > 0 OR PR > 0) & Not Luminal A/B.
- Triple Negative: HER2 (0/1) & ER = 0 & PR = 0.
Load Data
 [1] "case_id"                "er_pre"                 "er_post"
 [4] "pr_pre"                 "pr_post"                "her2_pre"
 [7] "her2_post"              "ki67_pre"               "ki67_post"
[10] "comment"                "pathologist"            "er_pre_cat"
[13] "er_post_cat"            "pr_pre_cat"             "pr_post_cat"
[16] "ki67_pre_cat20"         "ki67_post_cat20"        "ki67_pre_cat30"
[19] "ki67_post_cat30"        "molecular_subtype_pre"  "molecular_subtype_post"
[22] "biopsy_type"
# A tibble: 6 × 22
  case_id  er_pre er_post pr_pre pr_post her2_pre her2_post ki67_pre ki67_post
  <chr>     <dbl>   <dbl>  <dbl>   <dbl> <fct>    <fct>        <dbl>     <dbl>
1 34937-25     90      95     60      64 1        1                6         6
2 35131-25    100      97      1       2 1        1               35        35
3 35077-25      0       0      0       0 3        3               60        60
4 35091-25     50      40      1       1 1        0                1         5
5 34367-25    100      96     50      70 0        0               10        11
6 34681-25    100     100    100     100 1        1               23        17
# ℹ 13 more variables: comment <chr>, pathologist <chr>, er_pre_cat <fct>,
#   er_post_cat <fct>, pr_pre_cat <fct>, pr_post_cat <fct>,
#   ki67_pre_cat20 <fct>, ki67_post_cat20 <fct>, ki67_pre_cat30 <fct>,
#   ki67_post_cat30 <fct>, molecular_subtype_pre <chr>,
#   molecular_subtype_post <chr>, biopsy_type <fct>
[1] "Filtered to common cohort. Merged N: 1184"
[1] "Before NA removal: 1184"
[1] "After NA removal: 1037"
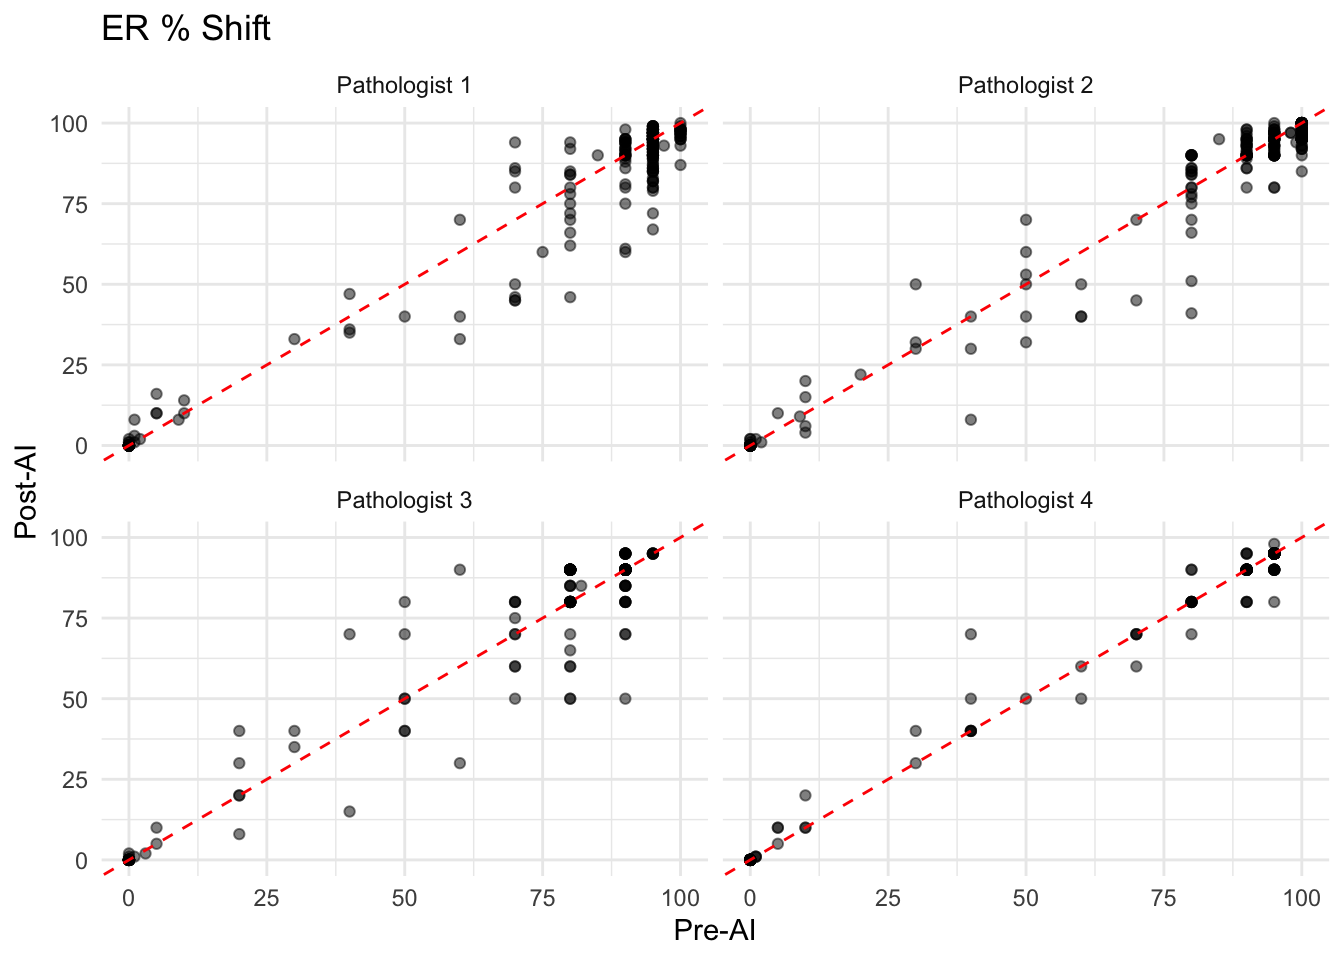
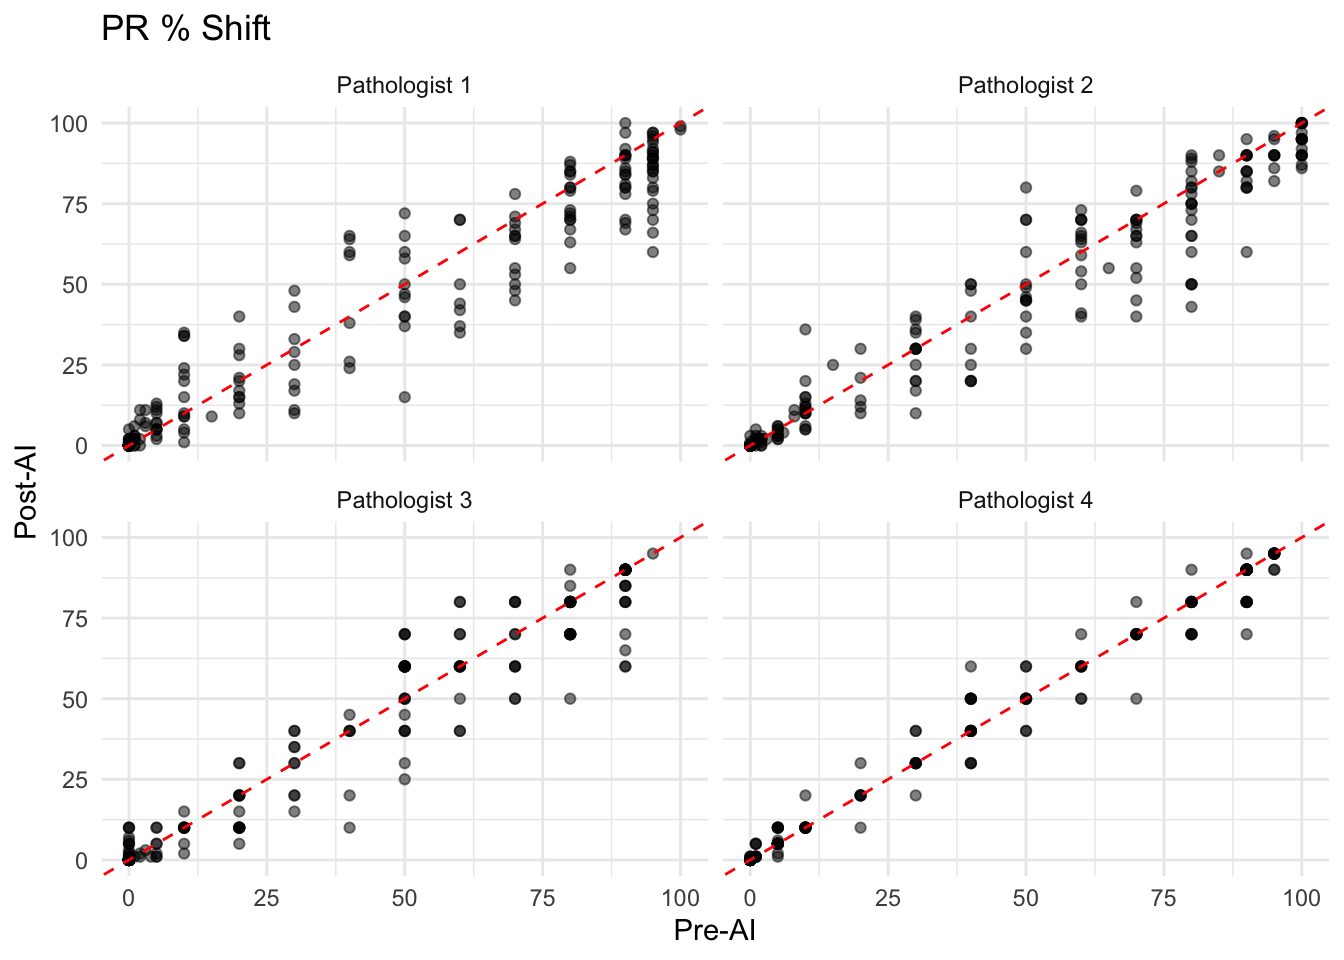
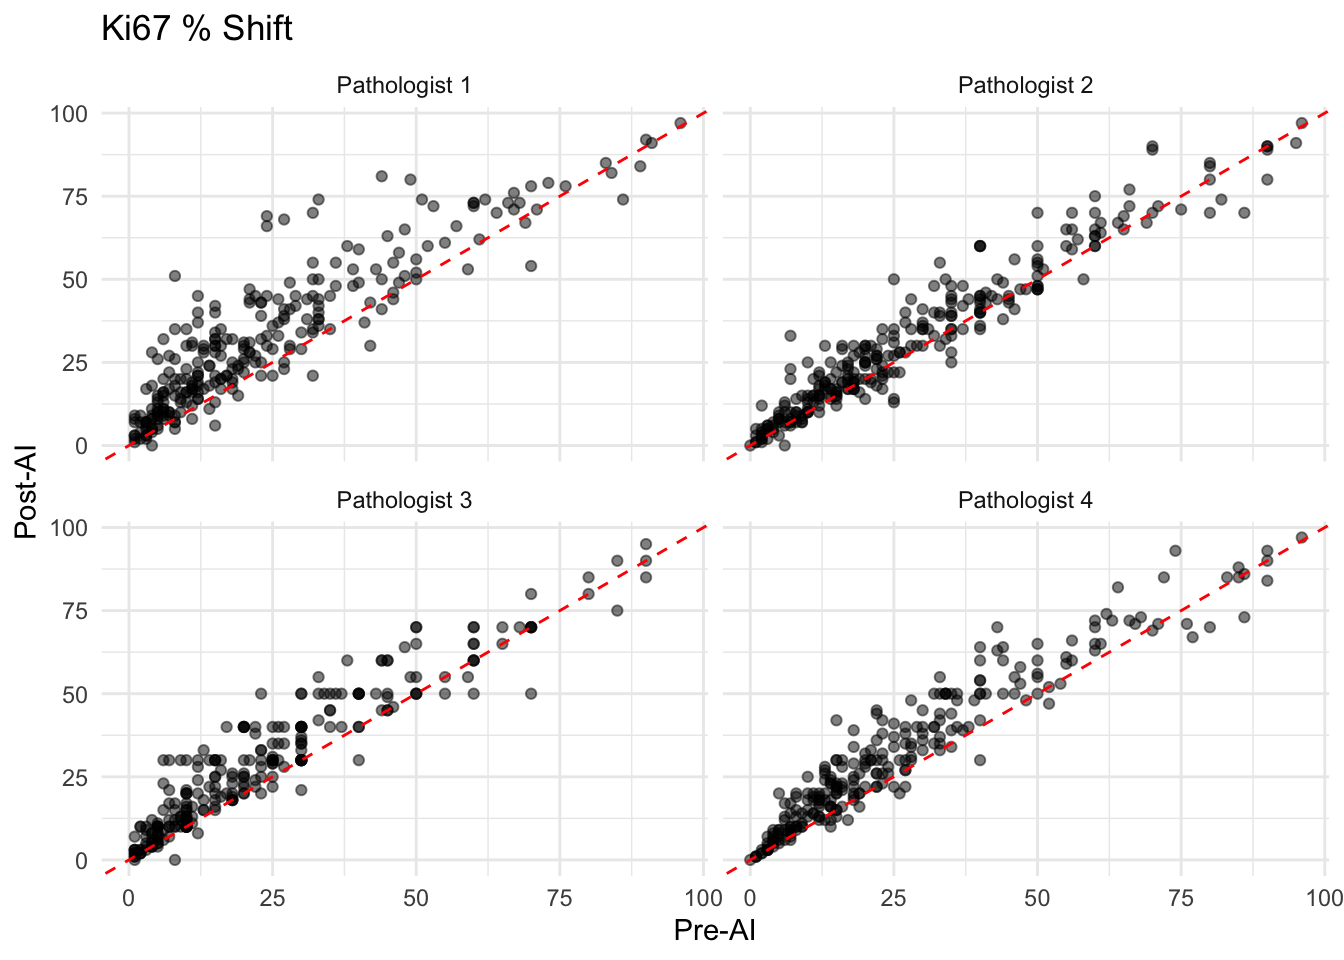
Change in Interpretation (Continuous Variables)
Visualize the shift in ER, PR, and Ki67 scores for each pathologist.
Intra-observer Consistency (Non-inferiority Analysis)
Following the methodology of Abele et al. (2023), we assess the consistency between Pre-AI and Post-AI scoring. Abele et al. proposed a non-inferiority margin of 75% agreement for categorized variables when evaluating AI assistance tools in routine diagnostics. High consistency (>75%) suggests that AI assistance does not disrupt the diagnostic reliability.
| Benchmark: >75% Agreement indicates Non-inferiority (Abele et al. 2023) |
| ER_Agreement_Rate |
99.2 |
75 |
Non-inferior (Pass) |
| PR_Agreement_Rate |
96.6 |
75 |
Non-inferior (Pass) |
| Ki67_Agreement_Rate |
85.1 |
75 |
Non-inferior (Pass) |
| HER2_Agreement_Rate |
94.2 |
75 |
Non-inferior (Pass) |
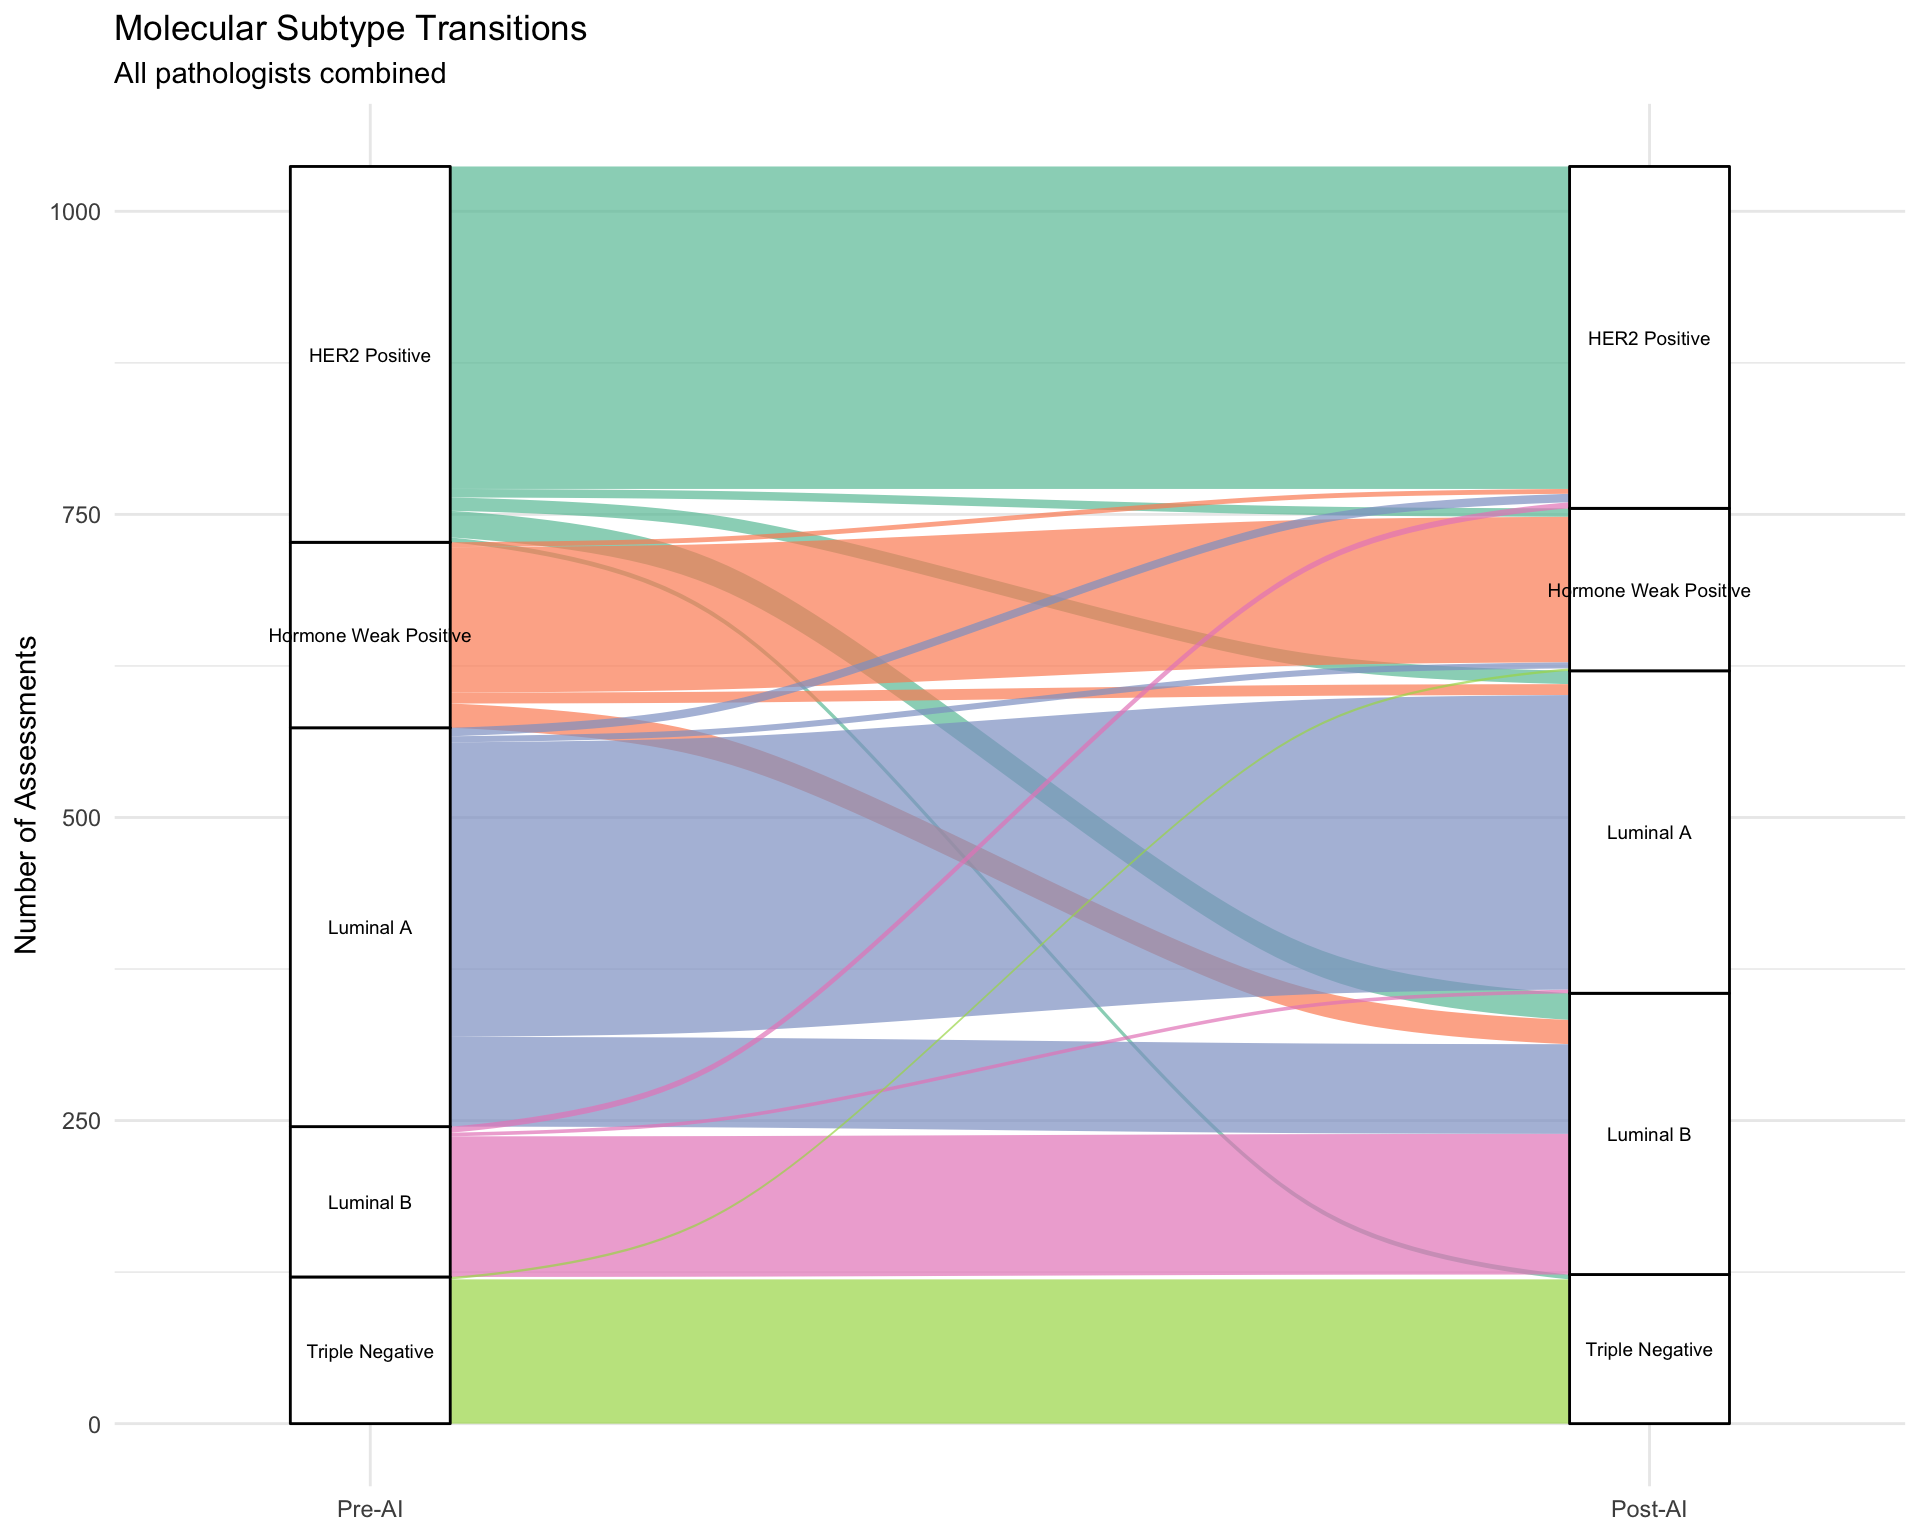
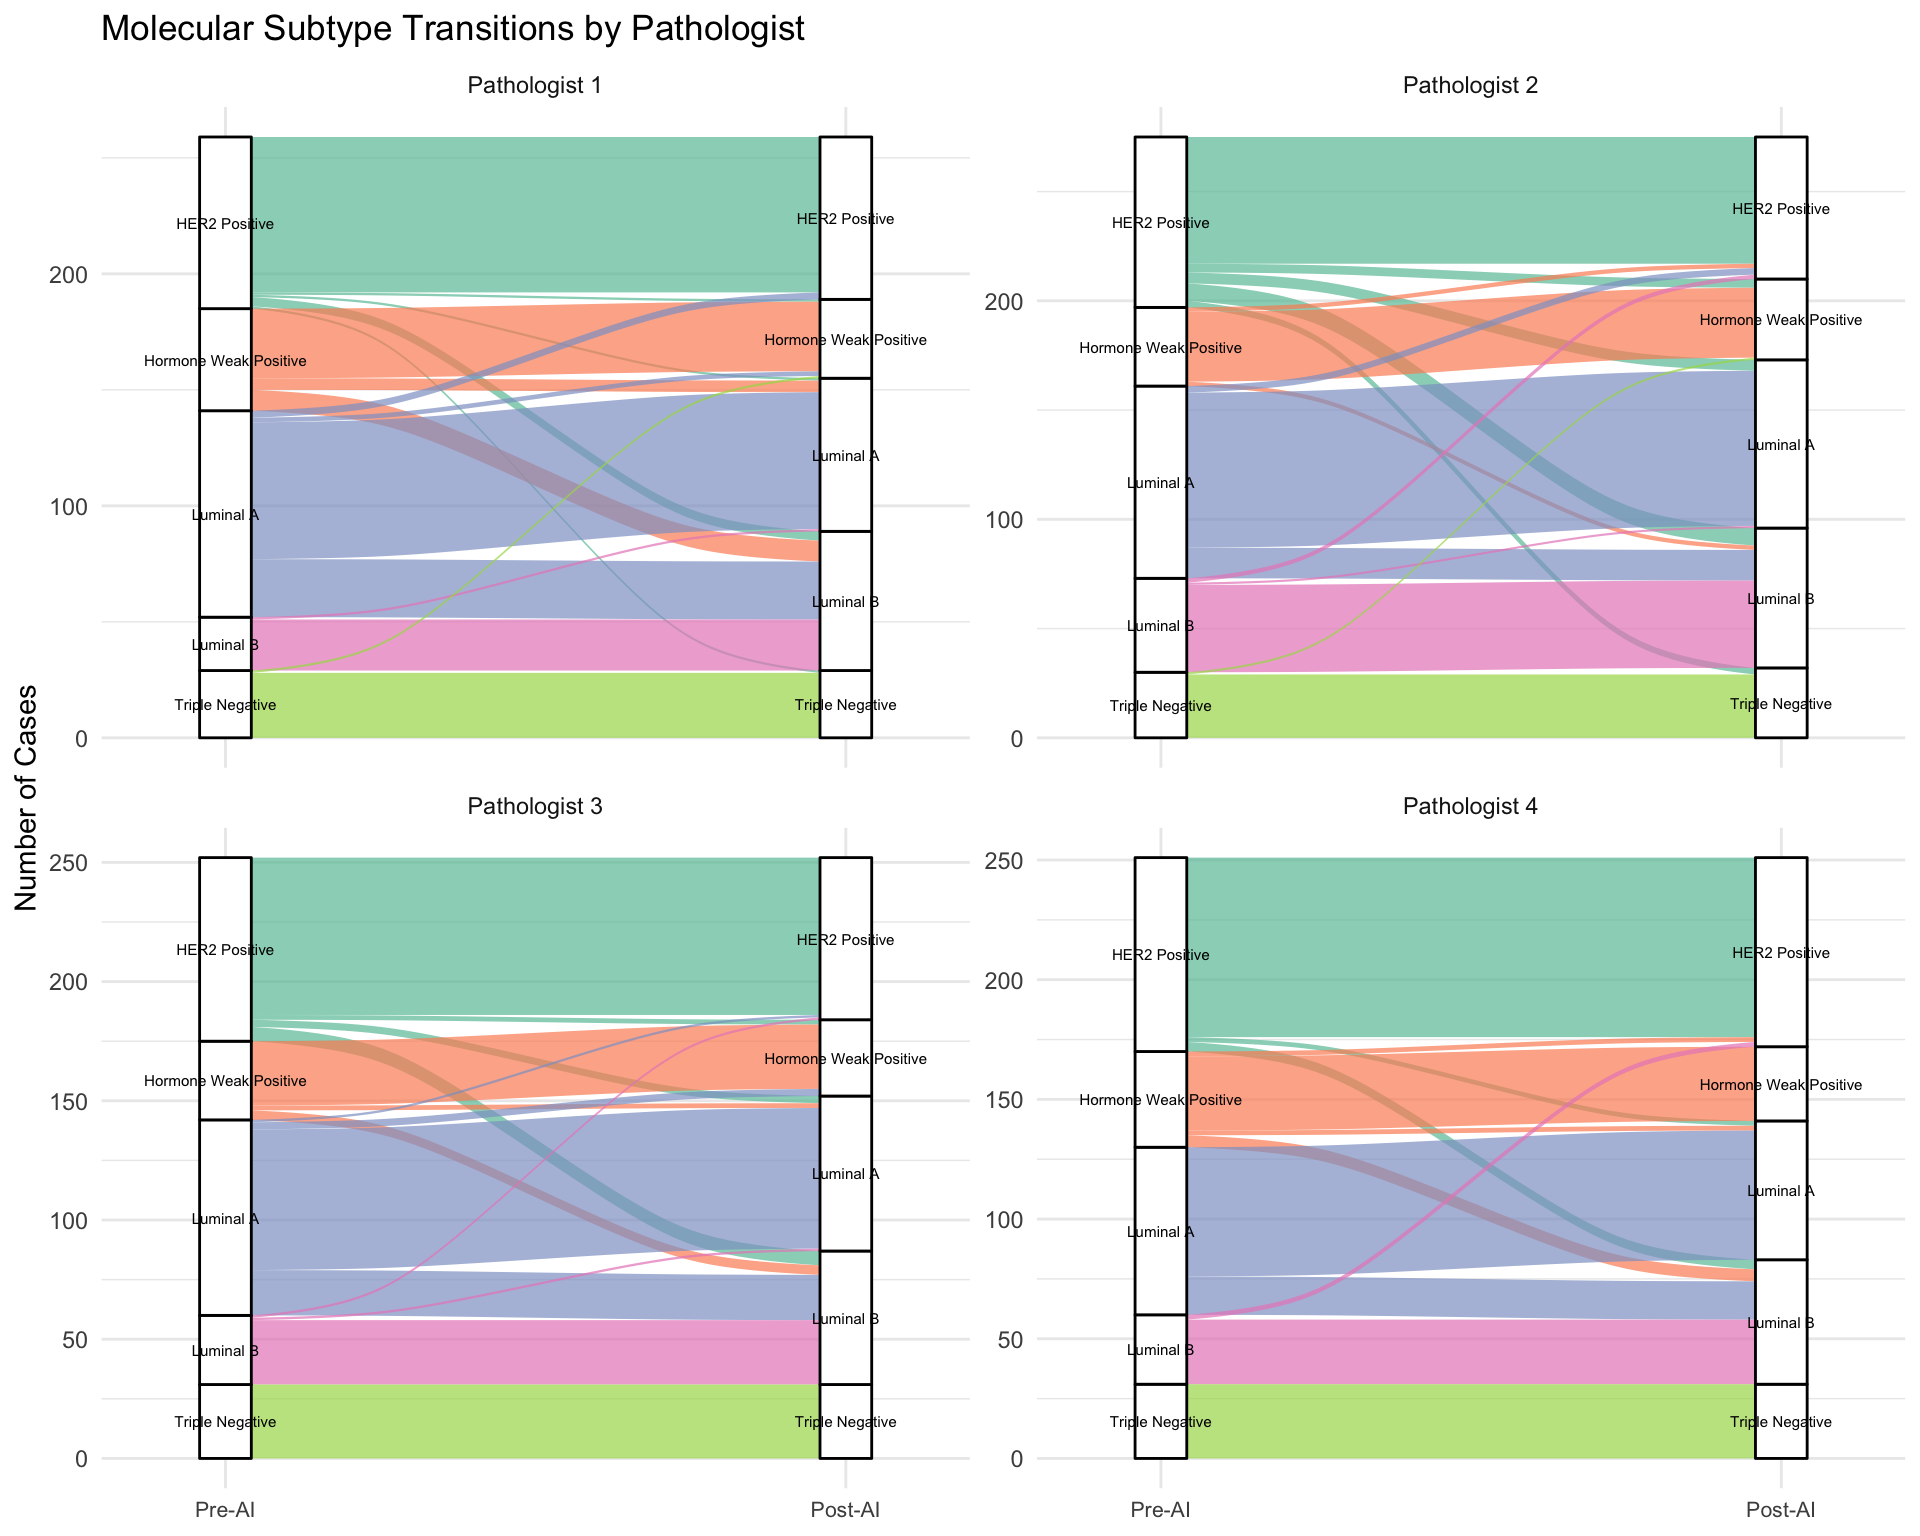
Molecular Subtype Changes
Visualize transitions between molecular subtypes after AI assistance.
| Rows = Pre-AI, Columns = Post-AI |
| HER2 Positive |
266 |
7 |
11 |
22 |
4 |
| Hormone Weak Positive |
4 |
120 |
9 |
20 |
0 |
| Luminal A |
7 |
5 |
243 |
74 |
0 |
| Luminal B |
5 |
0 |
3 |
116 |
0 |
| Triple Negative |
0 |
2 |
0 |
0 |
119 |
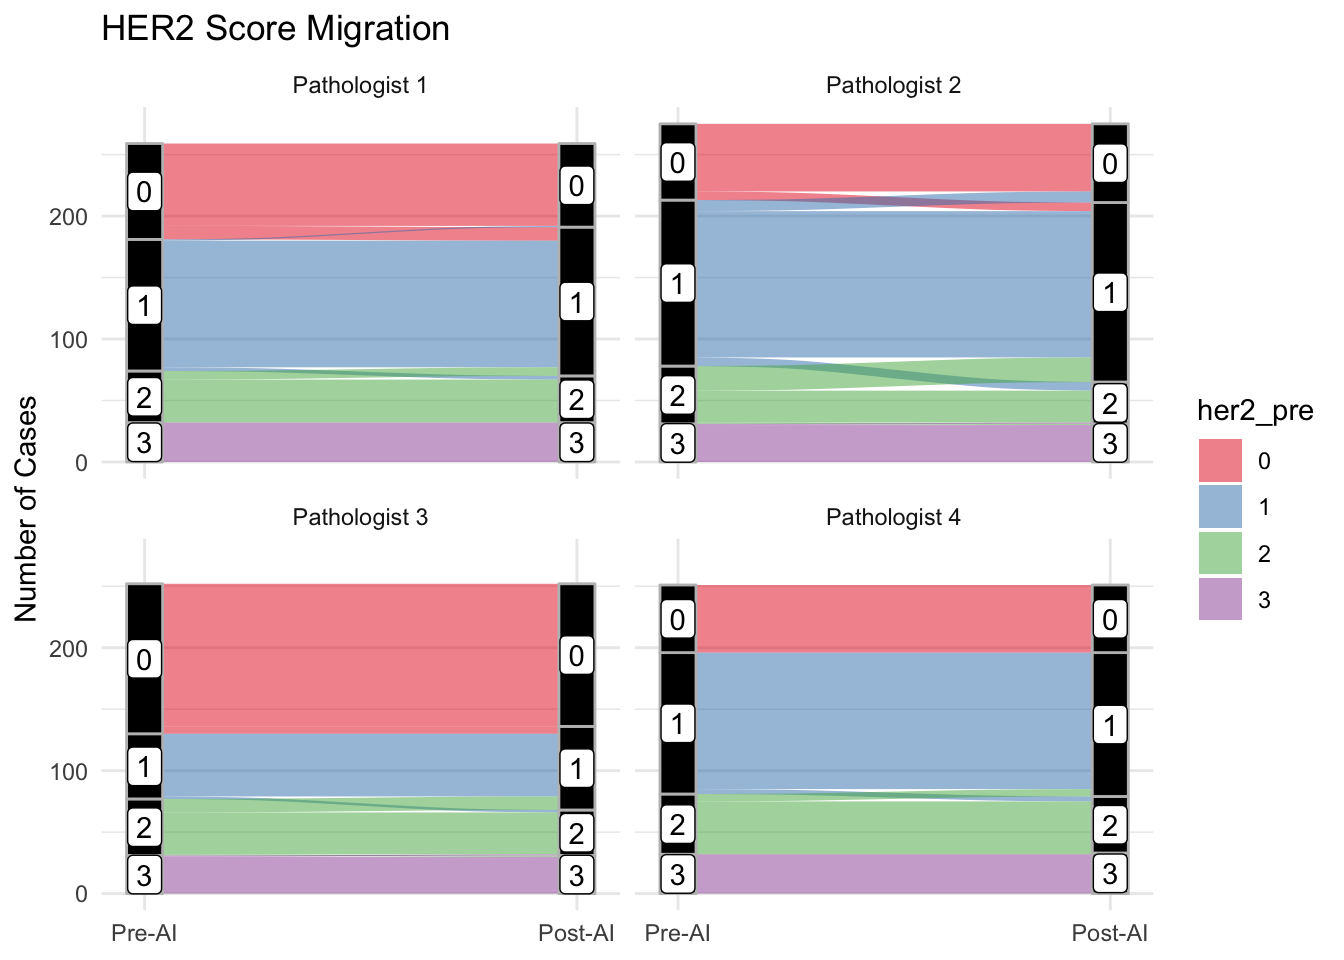
Change in Interpretation (HER2)
Visualize the shift in HER2 scores using Sankey diagrams.
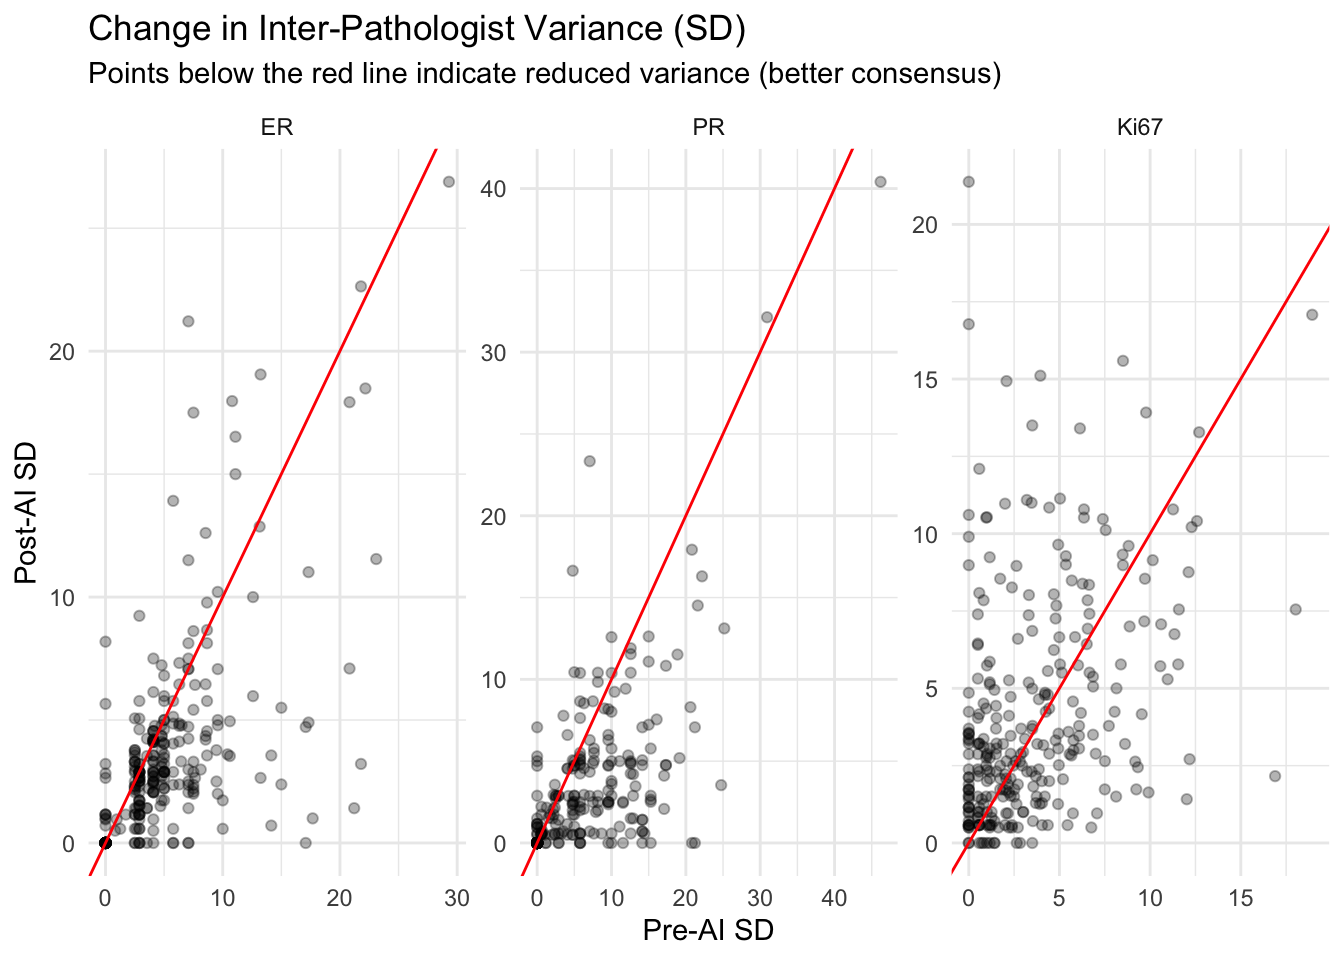
Consensus Analysis
Did the variance among pathologists decrease after AI?
Documenting Major Changes
Identify cases where the diagnosis changed significantly (e.g., HER2 1+ -> 3+, or ER Negative -> Positive).
| case_id |
pathologist |
her2_pre |
her2_post |
comment |
| 35091-25 |
Pathologist 2 |
1 |
0 |
tum membranlari algilamiyor |
| 33813-25 |
Pathologist 2 |
0 |
1 |
— |
| 33533-25 |
Pathologist 2 |
1 |
2 |
— |
| 33089-25 |
Pathologist 2 |
1 |
0 |
— |
| 31458-25 |
Pathologist 2 |
1 |
2 |
— |
| 30130-25 |
Pathologist 2 |
0 |
1 |
— |
| 24311-25 |
Pathologist 2 |
2 |
1 |
— |
| 23916-25 |
Pathologist 2 |
2 |
1 |
er pr her2 yok |
| 23259-25 |
Pathologist 2 |
0 |
1 |
lobuler karsinomu taniyamiyor |
| 22977-25 |
Pathologist 2 |
2 |
1 |
— |
| 22026-25 |
Pathologist 2 |
1 |
0 |
— |
| 20235-25 |
Pathologist 2 |
1 |
0 |
%10u hesaplayamadim |
| 20234-25 |
Pathologist 2 |
2 |
1 |
— |
| 20256-25 |
Pathologist 2 |
2 |
3 |
ER cok zor. Her2 sayinca ikna oldum. |
| 19362-25 |
Pathologist 2 |
1 |
0 |
— |
| 19361-25 |
Pathologist 2 |
2 |
1 |
— |
| 19258-25 |
Pathologist 2 |
1 |
2 |
— |
| 18413-25 |
Pathologist 2 |
2 |
1 |
— |
| 18012-25 |
Pathologist 2 |
2 |
1 |
PR: hemosiderini pozitif algiliyor |
| 18217-25 |
Pathologist 2 |
2 |
1 |
— |
| 16396-25 |
Pathologist 2 |
1 |
0 |
— |
| 16497-25 |
Pathologist 2 |
1 |
0 |
— |
| 15965-25 |
Pathologist 2 |
2 |
1 |
— |
| 15840-25 |
Pathologist 2 |
1 |
2 |
— |
| 14982-25 |
Pathologist 2 |
2 |
1 |
— |
| 14987-25 |
Pathologist 2 |
2 |
1 |
— |
| 12343-25 |
Pathologist 2 |
1 |
0 |
— |
| 12068-25 |
Pathologist 2 |
2 |
1 |
PRde soluklari secmiyor |
| 12440-25 |
Pathologist 2 |
0 |
1 |
— |
| 11632-25 |
Pathologist 2 |
0 |
1 |
— |
| 10928-25 |
Pathologist 2 |
2 |
1 |
— |
| 10676-25 |
Pathologist 2 |
2 |
1 |
— |
| 10454-25 |
Pathologist 2 |
1 |
2 |
— |
| 10157-25 |
Pathologist 2 |
2 |
1 |
— |
| 9859-25 |
Pathologist 2 |
2 |
1 |
— |
| 9930-25 |
Pathologist 2 |
3 |
2 |
— |
| 9347-25 |
Pathologist 2 |
2 |
1 |
— |
| 8135-25 |
Pathologist 2 |
1 |
2 |
— |
| 7468-25 |
Pathologist 2 |
1 |
0 |
— |
| 7291-25 |
Pathologist 2 |
2 |
1 |
— |
| 7010-25 |
Pathologist 2 |
0 |
1 |
— |
| 6706-25 |
Pathologist 2 |
1 |
2 |
— |
| 6476-25 |
Pathologist 2 |
2 |
1 |
— |
| 6444-25 |
Pathologist 2 |
0 |
1 |
— |
| 5935-25 |
Pathologist 2 |
2 |
1 |
— |
| 34681-25 |
Pathologist 1 |
0 |
1 |
— |
| 30736-25 |
Pathologist 1 |
0 |
1 |
— |
| 30767-25 |
Pathologist 1 |
0 |
1 |
— |
| 29841-25 |
Pathologist 1 |
0 |
1 |
— |
| 28310-25 |
Pathologist 1 |
0 |
1 |
— |
| 27588-25 |
Pathologist 1 |
0 |
1 |
— |
| 25564-25 |
Pathologist 1 |
2 |
1 |
— |
| 22803-25 |
Pathologist 1 |
1 |
2 |
— |
| 21551-25 |
Pathologist 1 |
1 |
2 |
— |
| 15965-25 |
Pathologist 1 |
2 |
1 |
— |
| 14933-25 |
Pathologist 1 |
0 |
1 |
— |
| 14058-25 |
Pathologist 1 |
2 |
1 |
— |
| 13833-25 |
Pathologist 1 |
2 |
1 |
— |
| 13471-25 |
Pathologist 1 |
0 |
1 |
— |
| 12343-25 |
Pathologist 1 |
0 |
1 |
— |
| 12818-25 |
Pathologist 1 |
2 |
1 |
— |
| 9859-25 |
Pathologist 1 |
2 |
1 |
SOLID PAPILLER KARSINOM tIS ALACAK MIYIZ? |
| 7468-25 |
Pathologist 1 |
1 |
0 |
— |
| 7291-25 |
Pathologist 1 |
2 |
1 |
— |
| 7010-25 |
Pathologist 1 |
0 |
1 |
— |
| 6706-25 |
Pathologist 1 |
1 |
2 |
— |
| 6444-25 |
Pathologist 1 |
0 |
1 |
— |
| 33533-25 |
Pathologist 4 |
1 |
2 |
— |
| 30029-25 |
Pathologist 4 |
2 |
1 |
6 |
| 24311-25 |
Pathologist 4 |
2 |
1 |
— |
| 22030-25 |
Pathologist 4 |
2 |
1 |
— |
| 20823-25 |
Pathologist 4 |
2 |
1 |
— |
| 20256-25 |
Pathologist 4 |
2 |
3 |
— |
| 15840-25 |
Pathologist 4 |
1 |
2 |
— |
| 14987-25 |
Pathologist 4 |
2 |
1 |
SKOR 2 DERDIM AMA AI ILE %3 KADAR ORTA KOMPLET MEMBRANOZ BOYANMA DIYINCE VAZGECTIM. |
| 8399-25 |
Pathologist 4 |
1 |
2 |
rutin sirasinda skor 2 der mi diye baska birisinden gorus alacagim bir vaka, AI skor 2 diyince ikna oldum. |
| 7636-25 |
Pathologist 4 |
1 |
2 |
— |
| 7291-25 |
Pathologist 4 |
2 |
1 |
— |
| 31448-25 |
Pathologist 3 |
0 |
1 |
— |
| 31485-25 |
Pathologist 3 |
0 |
1 |
— |
| 30029-25 |
Pathologist 3 |
0 |
1 |
— |
| 30017-25 |
Pathologist 3 |
0 |
1 |
— |
| 22977-25 |
Pathologist 3 |
2 |
1 |
— |
| 20234-25 |
Pathologist 3 |
2 |
1 |
— |
| 19731-25 |
Pathologist 3 |
1 |
2 |
— |
| 15655-25 |
Pathologist 3 |
2 |
1 |
— |
| 14886-25 |
Pathologist 3 |
2 |
1 |
— |
| 14987-25 |
Pathologist 3 |
2 |
1 |
— |
| 14074-25 |
Pathologist 3 |
2 |
1 |
— |
| 13833-25 |
Pathologist 3 |
2 |
1 |
— |
| 12675-25 |
Pathologist 3 |
2 |
3 |
— |
| 12366-25 |
Pathologist 3 |
2 |
1 |
t1 |
| 12068-25 |
Pathologist 3 |
2 |
1 |
— |
| 10719-25 |
Pathologist 3 |
3 |
2 |
— |
| 10183-25 |
Pathologist 3 |
0 |
1 |
— |
| 9859-25 |
Pathologist 3 |
2 |
1 |
— |
| 7291-25 |
Pathologist 3 |
2 |
1 |
— |
| 6706-25 |
Pathologist 3 |
1 |
2 |
— |
| 6444-25 |
Pathologist 3 |
0 |
1 |
— |
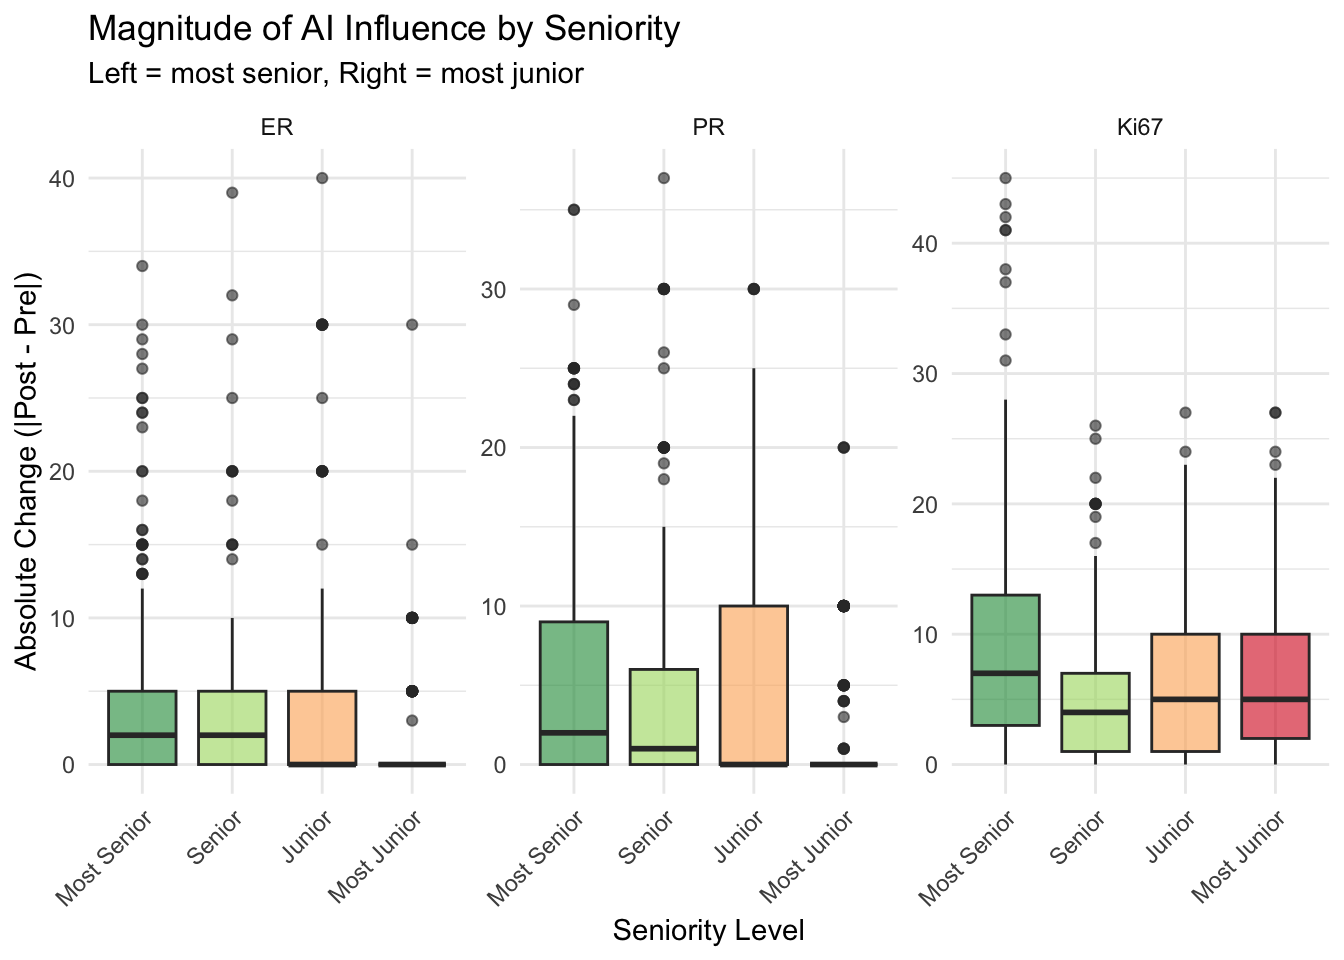
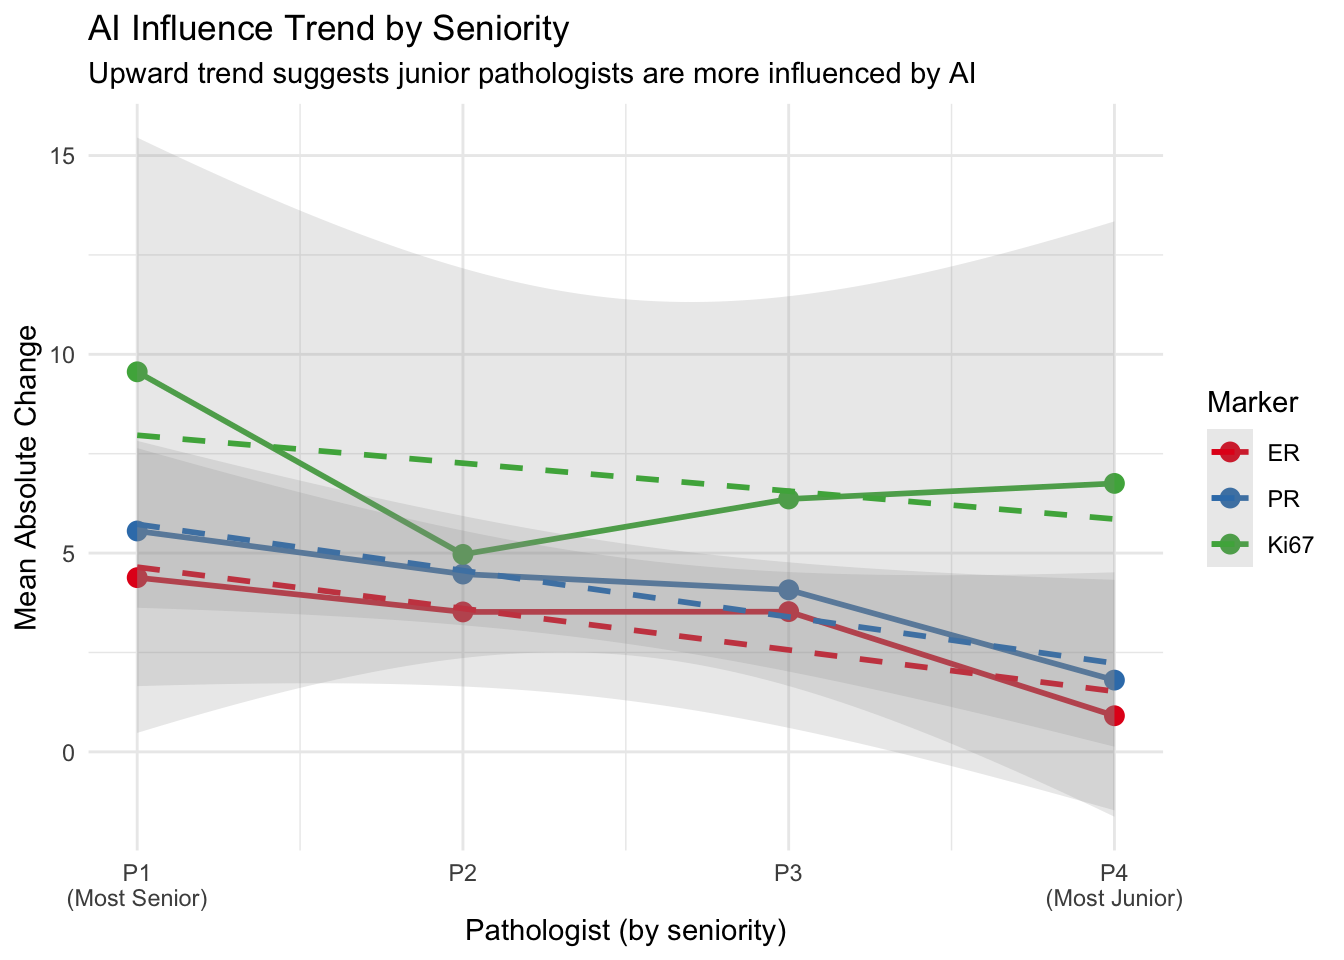
Influence of AI by Pathologist Seniority
Evaluate if the magnitude of change (influence) varies by pathologist experience level.
Assumption: Pathologist 1 is the most senior and Pathologist 4 is the most junior (P1 → P2 → P3 → P4, from most to least experienced). Wu et al. (2023) found that junior pathologists benefited most from AI assistance, showing greater score modifications after viewing AI suggestions (Wu et al. 2023).
Statistical Tests
| Spearman ρ > 0 indicates junior pathologists are more influenced |
| ER |
<0.001 |
−0.398 |
<0.001 |
2.000 |
0.000 |
<0.001 |
| PR |
<0.001 |
−0.254 |
<0.001 |
2.000 |
0.000 |
<0.001 |
| Ki67 |
<0.001 |
−0.084 |
0.007 |
7.000 |
5.000 |
<0.001 |
Seniority Trend Visualization
Interpretation of Influence
- Magnitude of Change (Delta): The “Absolute Change” represents how much the pathologist altered their score after seeing the AI result. A higher value indicates greater influence.
- Seniority Gradient: The trend plot shows the relationship between experience level and AI influence across all four pathologists, not just the extremes.
- A positive Spearman ρ indicates that junior pathologists show greater AI influence (consistent with Wu et al. 2023 findings that less experienced pathologists benefit more from AI assistance (Wu et al. 2023)).
- If the trend is flat, seniority may not be a primary factor in AI adoption/influence.
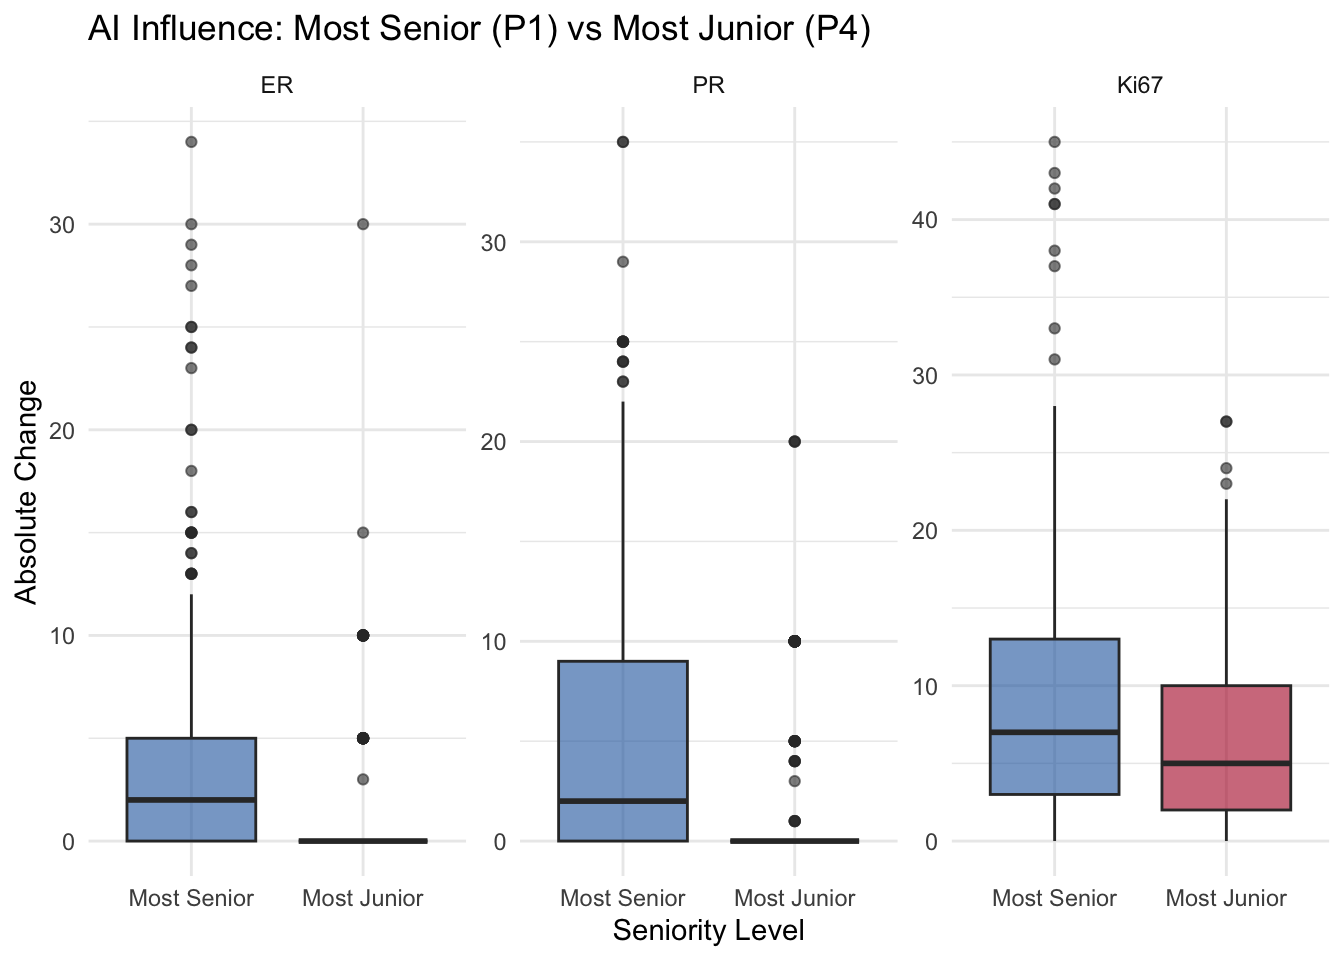
- Senior vs Junior: The boxplot compares the most senior (P1) and most junior (P4) pathologists directly.
- If P4 has a higher median delta, it suggests the junior pathologist is more influenced by the AI.
- Statistical Significance: The Kruskal-Wallis test assesses overall differences, Spearman ρ tests the seniority gradient, and the Wilcoxon test provides the direct P1 vs P4 comparison.
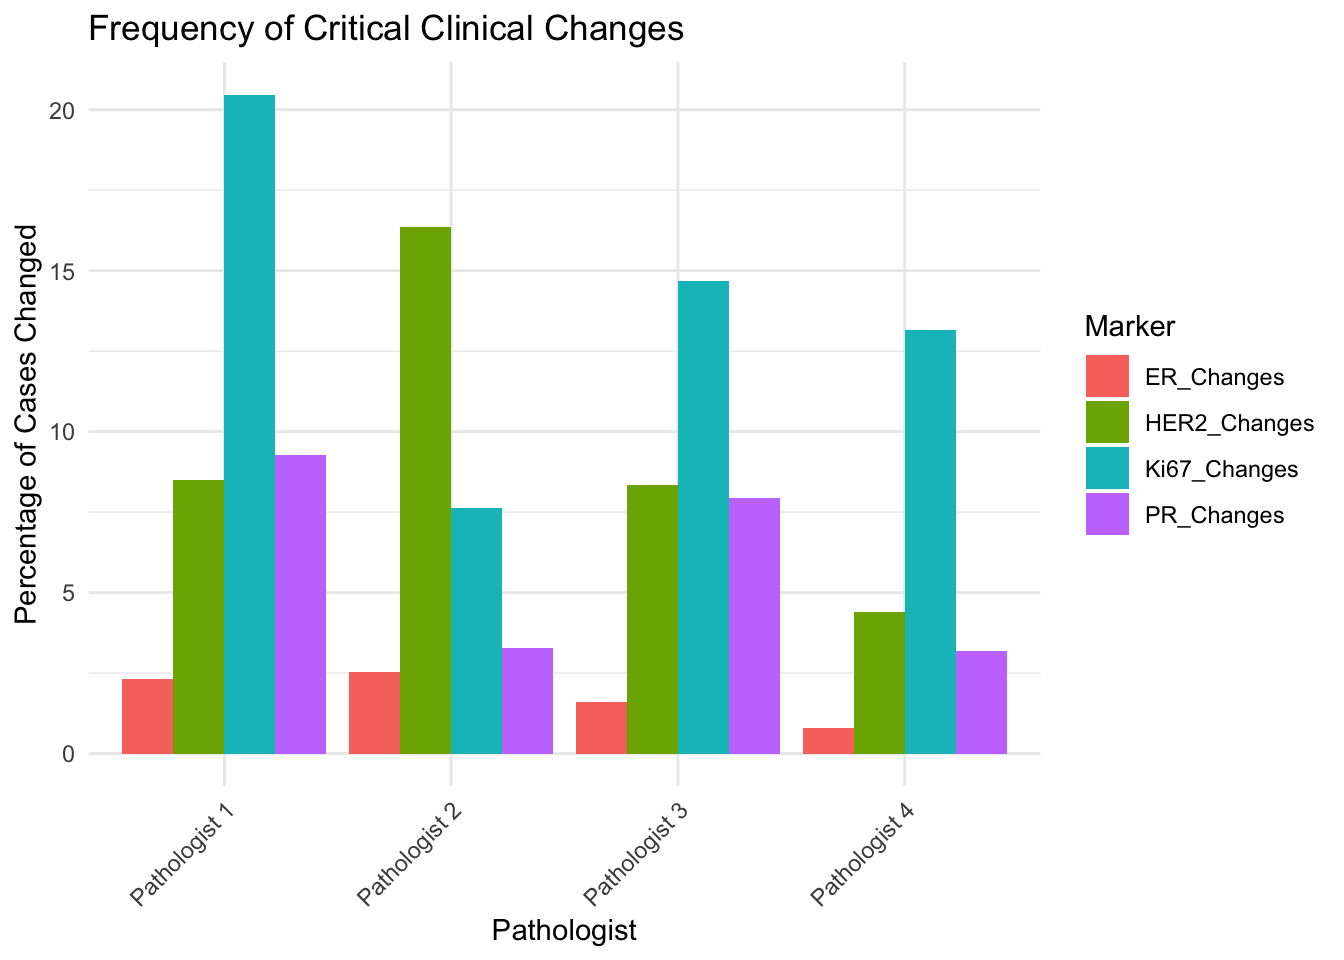
Critical Clinical Changes
Evaluate cases where the change in score crosses a clinically significant threshold.
Thresholds:
- ER/PR:
- Negative: 0%
- Low Positive: 1-9%
- Positive: >= 10%
- Critical Change: Moving between these categories.
- Ki67:
- Low: < 30%
- High: >= 30%
- Critical Change: Moving across the 30% threshold.
- HER2:
- Any Change: Any difference in score (0, 1, 2, 3) is considered critical.
Conclusion
Interpretation of Results
- Shift in Scores:
- In the scatter plots, points falling on the red dashed line indicate no change in the pathologist’s assessment after AI assistance.
- Points above the line suggest the AI score was higher, while points below indicate the AI score was lower.
- A systematic shift (e.g., most points above the line) would suggest the AI tends to grade higher than the pathologist.
- Variance Reduction (Consensus):
- The “Change in Inter-Pathologist Variance” plot shows the standard deviation (SD) of scores among pathologists for each case.
- Points below the red line indicate that the variance decreased after using AI (Post-AI SD < Pre-AI SD). This means the pathologists became more consistent with each other (better consensus).
- Points above the red line indicate increased variance (less consensus).
- Ideally, we want to see the majority of cases below the red line, suggesting AI helps standardize the diagnosis, a key benefit highlighted in broad reviews of AI in breast pathology (Liu et al. 2023; Soliman, Li, and Parwani 2024; Ibrahim et al. 2020; Baxi et al. 2022; Niazi, Parwani, and Gurcan 2019).
- Expert-AI Synergy:
- Niazi et al. (2019) emphasized that the “Expert-AI combination” yields results that are more accurate and consistent than what an expert can do alone. They argue that AI should not be seen as a replacement but as a tool that enables pathologists to extract information beyond human limits (e.g., sub-visual features) and provides a safety mechanism for error prevention (Niazi, Parwani, and Gurcan 2019).
- Shafi et al. (2022) validated this in a fully digital clinical workflow for ER assessment, demonstrating excellent concordance (93.8%) between automated analysis and manual scoring. Crucially, they highlighted that automated batch processing of biomarkers can significantly save time and labor while correctly identifying pitfalls like DCIS and benign glands (Shafi et al. 2022).
- Soliman et al. (2024), in a comprehensive review, concluded that AI integration stands to improve diagnostic accuracy and reduce avoidable errors across the board. They emphasized AI’s capability to standardize the quantification of biomarkers (ER, PR, HER2, Ki-67) and mitigate interobserver variability, advocating for its use not just as a diagnostic aid but as a tool for “adaptive sampling” to handle large whole-slide images efficiently (Soliman, Li, and Parwani 2024).
Future Directions: The Technical Horizon
Near-Perfect Segmentation: The technical capabilities of AI are advancing rapidly. Begum & Kalaivani (2025) recently demonstrated a “Smart Neural Network” approach that achieved a Dice coefficient of ~99.9% for nuclei segmentation on the BreakHis dataset (Begum and Kalaivani 2025).
Implication: This level of technical precision suggests that the traditional “bottlenecks” of computer vision (e.g., inaccurate cell boundaries, overlapping nuclei) are being solved. The future challenge will shift from algorithm development to clinical integration, validation on diverse real-world datasets, and establishing trust with pathology teams.
HER2 Low Precision: With the advent of ADCs like trastuzumab-deruxtecan (DESTINY-Breast04), distinguishing HER2 Score 0 from 1+ has become a critical clinical threshold. Albuquerque et al. (2025) confirm that AI is highly sensitive (0.97) for this task, potentially serving as an effective screening tool to ensure eligible patients are not missed, though expert review remains essential for final scoring (Albuquerque et al. 2025).
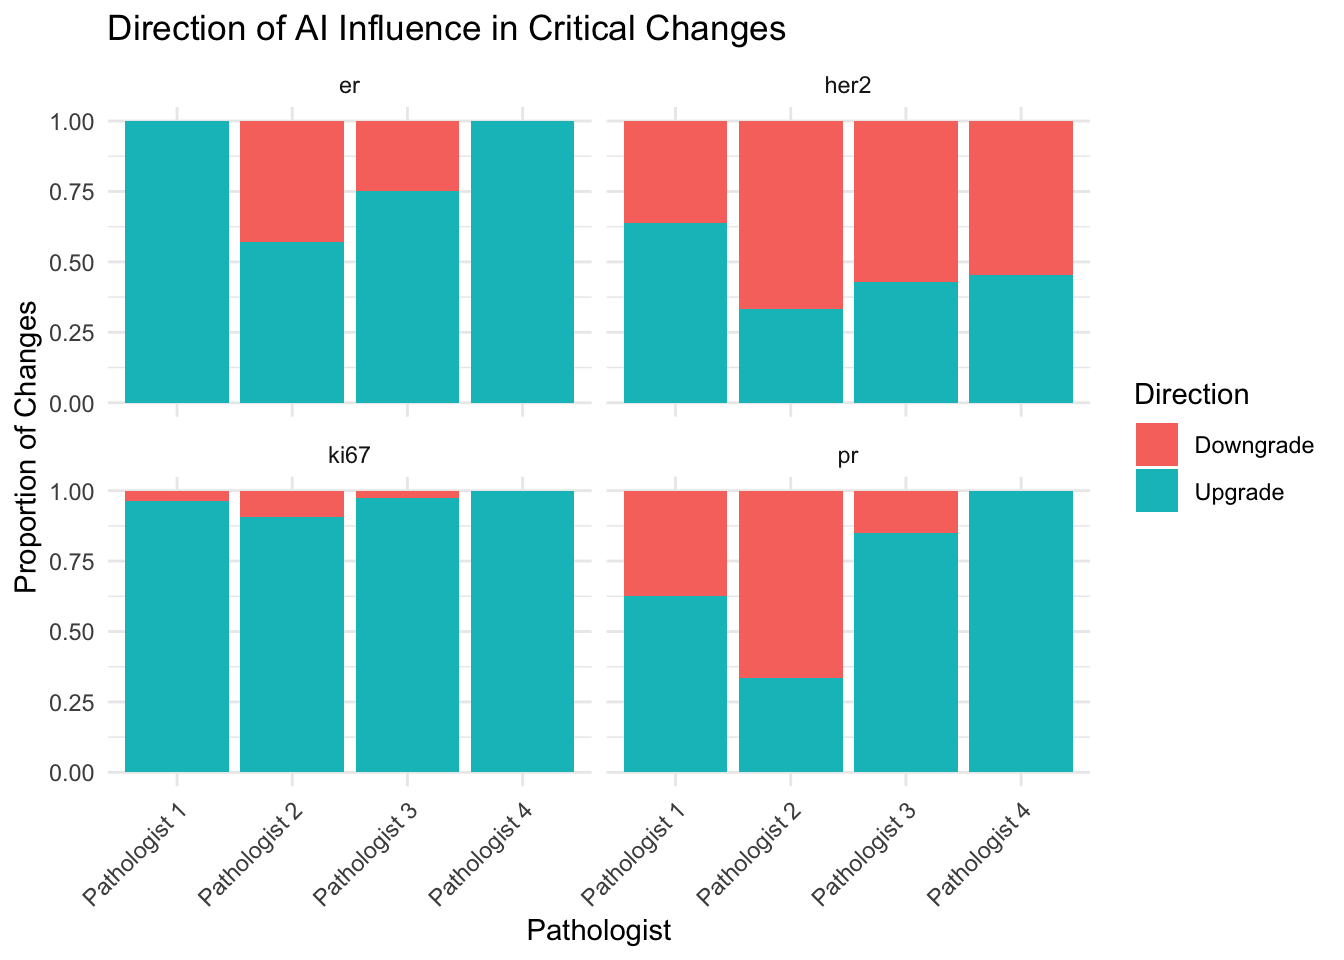
Major Diagnostic Changes:
- The table “Cases with Changed HER2 Scores” highlights clinically significant disagreements between the pathologist’s initial review and the AI-assisted review.
- Changes between HER2 Negative (0/1+) and Positive (3+) are critical as they directly impact treatment eligibility (e.g., Herceptin).
- Changes involving Equivocal (2+) cases are also important, as they often trigger reflex testing (FISH).
Challenges to Implementation
While the benefits of AI in standardization and efficiency are clear, broader implementation faces significant hurdles. Reis-Filho & Kather (2023) outlined the key challenges that must be overcome for widespread adoption:
- Cultural Shift: The transition from the microscope to a digital screen represents a fundamental change in pathology practice that can meet resistance.
- Quality Control: AI algorithms are sensitive to variations in tissue processing and staining (“garbage in, garbage out”). Ensuring that AI models generalize across different laboratories is a major technical hurdle.
- Regulatory & Financial: The regulatory landscape for AI-based biomarkers is complex, and the financial cost of digitizing pathology departments (scanners, storage) remains a significant barrier without clear reimbursement models (Reis-Filho and Kather 2023).
Albuquerque, Daniel Arruda Navarro, Matheus Trotta Vianna, Andrei Vasiliu, Eduardo Henrique Cunha Neves Filho, and Luana Alencar Fernandes Sampaio. 2025.
“Systematic Review and Meta-Analysis of Artificial Intelligence in Classifying HER2 Status in Breast Cancer Immunohistochemistry.” Npj Digital Medicine 8 (1): 144.
https://doi.org/10.1038/s41746-025-01483-8.
Baxi, Vipul, Robin Edwards, Michael Montalto, and Saurabh Saha. 2022.
“Digital Pathology and Artificial Intelligence in Translational Medicine and Clinical Practice.” Modern Pathology 35 (1): 23–32.
https://doi.org/10.1038/s41379-021-00919-2.
Begum, M Suriya, and S Kalaivani. 2025.
“Smart Neural Network and Cognitive Computing Process for Multi Task Nuclei Detection Segmentation and Classification in Breast Cancer Histopathology Images.” Scientific Reports 15 (1): 18435.
https://doi.org/10.1038/s41598-025-02575-x.
Ibrahim, Asmaa, Paul Gamble, Ronnachai Jaroensri, Mohammed M Abdelsamea, Craig H Mermel, Po-Hsuan Cameron Chen, and Emad A Rakha. 2020.
“Artificial Intelligence in Digital Breast Pathology: Techniques and Applications.” The Breast 49: 267–73.
https://doi.org/10.1016/j.breast.2019.12.007.
Liu, Yueping, Dandan Han, Anil V Parwani, and Zaibo Li. 2023.
“Applications of Artificial Intelligence in Breast Pathology.” Archives of Pathology & Laboratory Medicine 147 (9): 1003–13.
https://doi.org/10.5858/arpa.2022-0457-RA.
Niazi, Muhammad Khalid Khan, Anil V Parwani, and Metin N Gurcan. 2019.
“Digital Pathology and Artificial Intelligence.” The Lancet Oncology 20 (5): e253–61.
https://doi.org/10.1016/S1470-2045(19)30154-8.
Reis-Filho, Jorge S, and Jakob Nikolas Kather. 2023.
“Overcoming the Challenges to Implementation of Artificial Intelligence in Pathology.” Journal of the National Cancer Institute 115 (6): 608–12.
https://doi.org/10.1093/jnci/djad048.
Shafi, Saba, David A Kellough, Giovanni Lujan, Swati Satturwar, Anil V Parwani, and Zaibo Li. 2022.
“Integrating and Validating Automated Digital Imaging Analysis of Estrogen Receptor Immunohistochemistry in a Fully Digital Workflow for Clinical Use.” Journal of Pathology Informatics 13: 100122.
https://doi.org/10.1016/j.jpi.2022.100122.
Soliman, Amr, Zaibo Li, and Anil V Parwani. 2024.
“Artificial Intelligence’s Impact on Breast Cancer Pathology: A Literature Review.” Diagnostic Pathology 19 (1): 38.
https://doi.org/10.1186/s13000-024-01453-w.
Wu, Si, Meng Yue, Jun Zhang, Xiaoxian Li, Zaibo Li, Huina Zhang, Xinran Wang, et al. 2023.
“The Role of Artificial Intelligence in Accurate Interpretation of HER2 Immunohistochemical Scores 0 and 1+ in Breast Cancer.” Modern Pathology 36 (3): 100054.
https://doi.org/10.1016/j.modpat.2022.100054.