Objective
Analyze each pathologist’s consistency, AI adoption patterns, and performance characteristics.
Note for Pathologist: This section gets personal (anonymously). We look at how each pathologist interacted with the AI. Did they change their mind often? Did they only change for difficult cases? This helps us understand if the AI acts as a “second opinion” that everyone trusts, or if some users are more skeptical than others.
Intra-Pathologist Consistency
Measure how consistent each pathologist is with themselves (within-pathologist variability).
| Correlation between Pre-AI and Post-AI assessments |
| Pathologist 1 |
0.981 |
0.970 |
0.899 |
| Pathologist 2 |
0.987 |
0.977 |
0.961 |
| Pathologist 3 |
0.976 |
0.975 |
0.945 |
| Pathologist 4 |
0.997 |
0.993 |
0.955 |
| Average magnitude of change after AI |
| Pathologist 1 |
4.38 |
5.56 |
9.56 |
| Pathologist 2 |
3.52 |
4.47 |
4.97 |
| Pathologist 3 |
3.53 |
4.08 |
6.36 |
| Pathologist 4 |
0.91 |
1.80 |
6.75 |
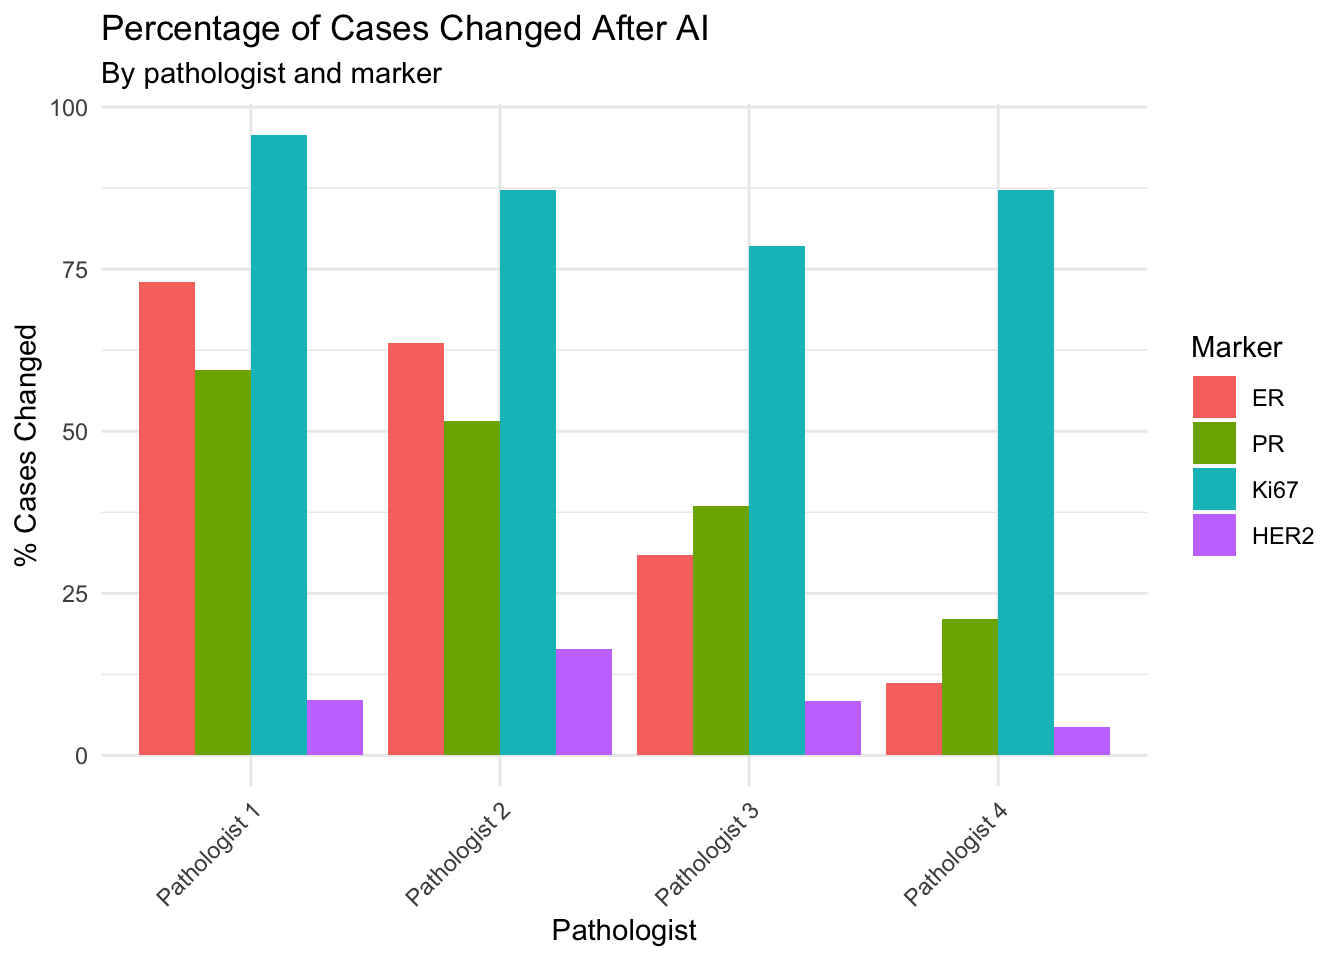
Note for Pathologist: The tables and bar chart above show self-consistency metrics. A high Pre-Post correlation (close to 1.0) means the pathologist rarely changed their scores after seeing the AI result. A high MAE (Mean Absolute Error) means they changed by large amounts. The percentage of cases changed shows how often they adjusted any value at all.
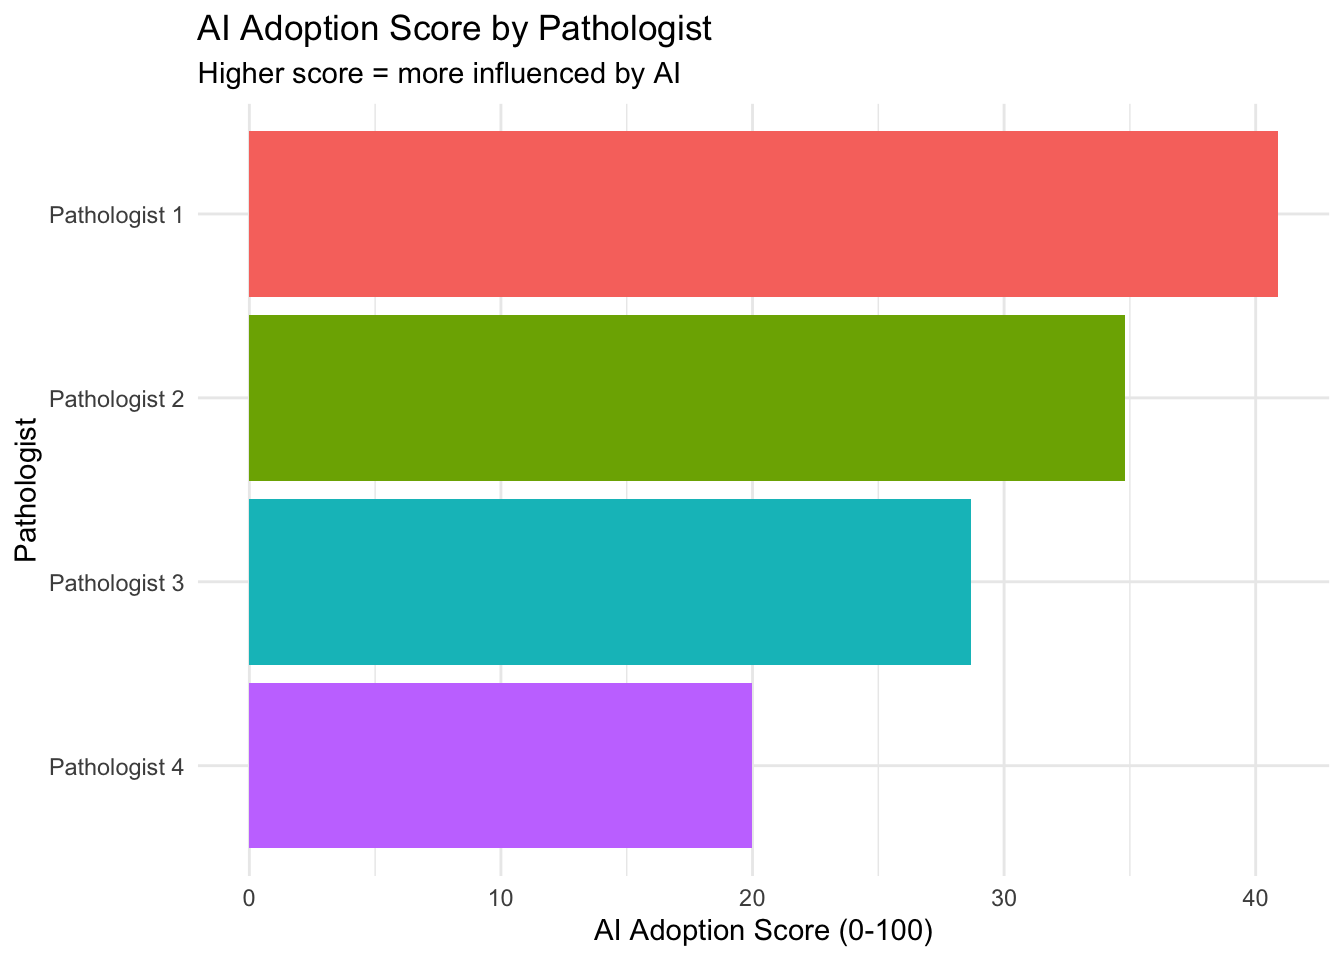
AI Adoption Index
Create a composite metric of how much each pathologist is influenced by AI.
| How much each pathologist is influenced by AI |
| Pathologist 1 |
40.89 |
4.38 |
5.56 |
9.56 |
0.73 |
0.59 |
0.08 |
| Pathologist 2 |
34.81 |
3.52 |
4.47 |
4.97 |
0.64 |
0.52 |
0.16 |
| Pathologist 3 |
28.69 |
3.53 |
4.08 |
6.36 |
0.31 |
0.38 |
0.08 |
| Pathologist 4 |
19.98 |
0.91 |
1.80 |
6.75 |
0.11 |
0.21 |
0.04 |
Extreme Value Analysis
Identify pathologists who tend to give extreme or moderate values.
| Proportion of cases with extreme scores |
| Pathologist 1 |
25.1% |
39.8% |
15.8% |
37.1% |
| Pathologist 2 |
52.7% |
43.3% |
26.5% |
38.9% |
| Pathologist 3 |
17.1% |
44.4% |
16.3% |
38.5% |
| Pathologist 4 |
17.9% |
41.0% |
17.9% |
39.8% |
Marker-Specific Expertise
Identify if pathologists show different patterns for different markers.
| Measures scoring variability (lower = more consistent) |
| Pathologist 1 |
0.520 |
0.528 |
1.182 |
1.161 |
0.869 |
0.678 |
| Pathologist 2 |
0.521 |
0.527 |
1.132 |
1.146 |
0.761 |
0.692 |
| Pathologist 3 |
0.518 |
0.522 |
1.167 |
1.178 |
0.849 |
0.710 |
| Pathologist 4 |
0.542 |
0.538 |
1.226 |
1.212 |
0.803 |
0.685 |
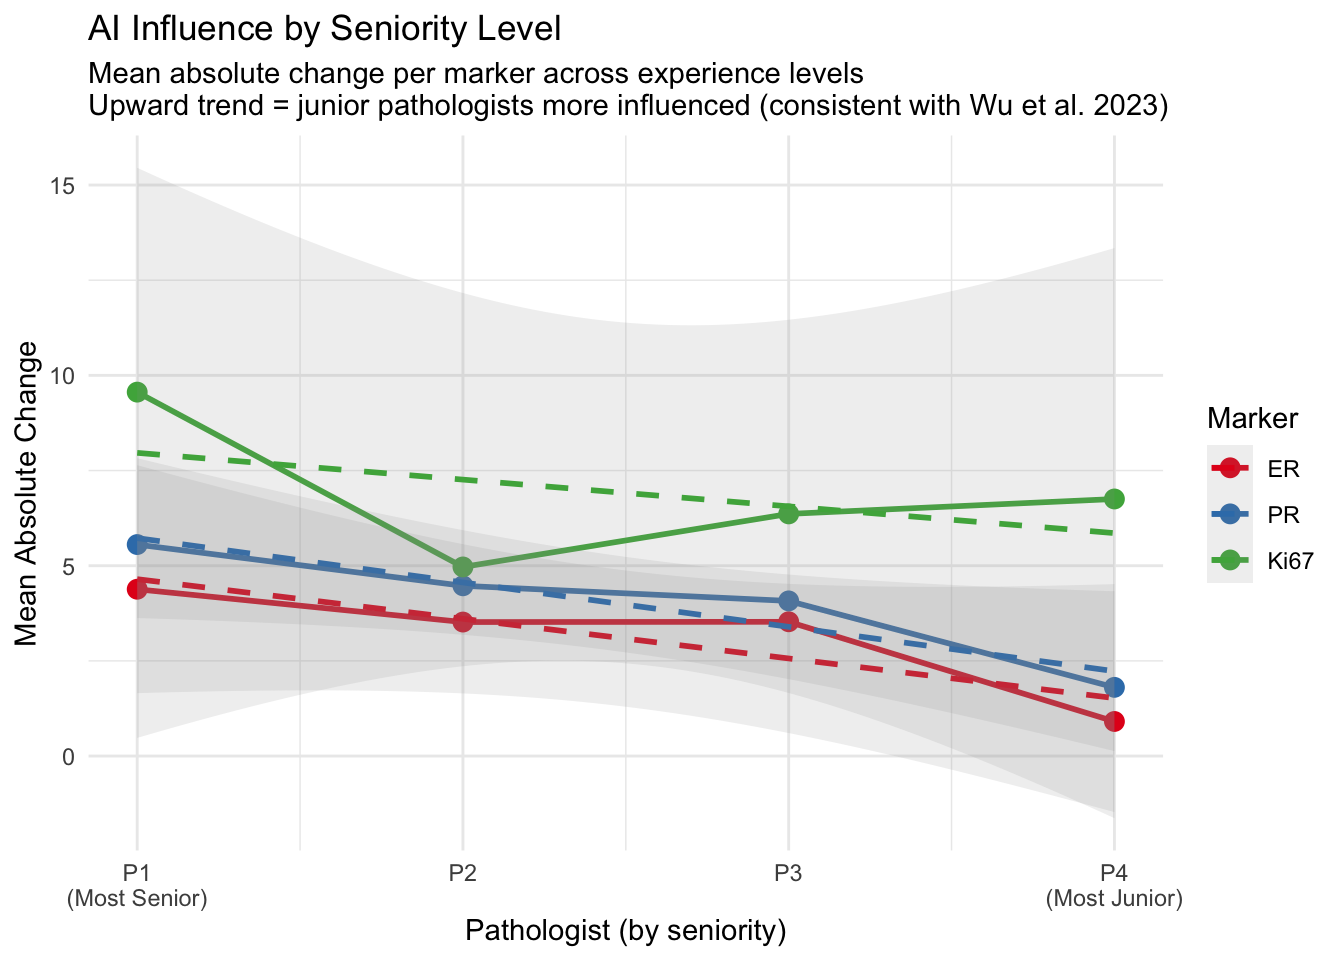
Seniority and AI Adoption Patterns
Evaluate how pathologist experience level relates to AI adoption behavior. Wu et al. (2023) found that junior pathologists benefited most from AI assistance (Wu et al. 2023).
Assumption: Pathologist 1 is the most senior and Pathologist 4 is the most junior (P1 → P2 → P3 → P4).
| P1 (most senior) → P4 (most junior) |
| Pathologist 1 |
Most Senior |
0.950 |
6.499 |
0.592 |
| Pathologist 2 |
Senior |
0.975 |
4.320 |
0.547 |
| Pathologist 3 |
Junior |
0.965 |
4.655 |
0.391 |
| Pathologist 4 |
Most Junior |
0.981 |
3.155 |
0.310 |
Seniority–Adoption Correlation
| Rank: 1 = most senior, 4 = most junior |
| Self-Consistency (r) |
0.800 |
0.333 |
Junior → higher consistency (less AI influence) |
| Mean Absolute Change |
−0.800 |
0.333 |
Junior → smaller changes (less AI influence) |
| Change Frequency |
−1.000 |
0.083 |
Junior → less frequent changes |
Seniority Trend Visualization
Conclusion
Key Insights
Individual Variability: Pathologists differ in:
- How consistent they are with their own initial assessments
- How much they are influenced by AI
- Their scoring patterns (extreme vs moderate)
AI Adoption and Seniority: More junior pathologists may adopt AI suggestions more readily, consistent with Wu et al. (2023) who found that less experienced pathologists benefited most from AI assistance (Wu et al. 2023). This could reflect:
- Lower confidence in initial assessments among junior pathologists
- Greater openness to AI technology in less experienced practitioners
- AI filling a knowledge gap that experience otherwise provides
- More established scoring habits in senior pathologists
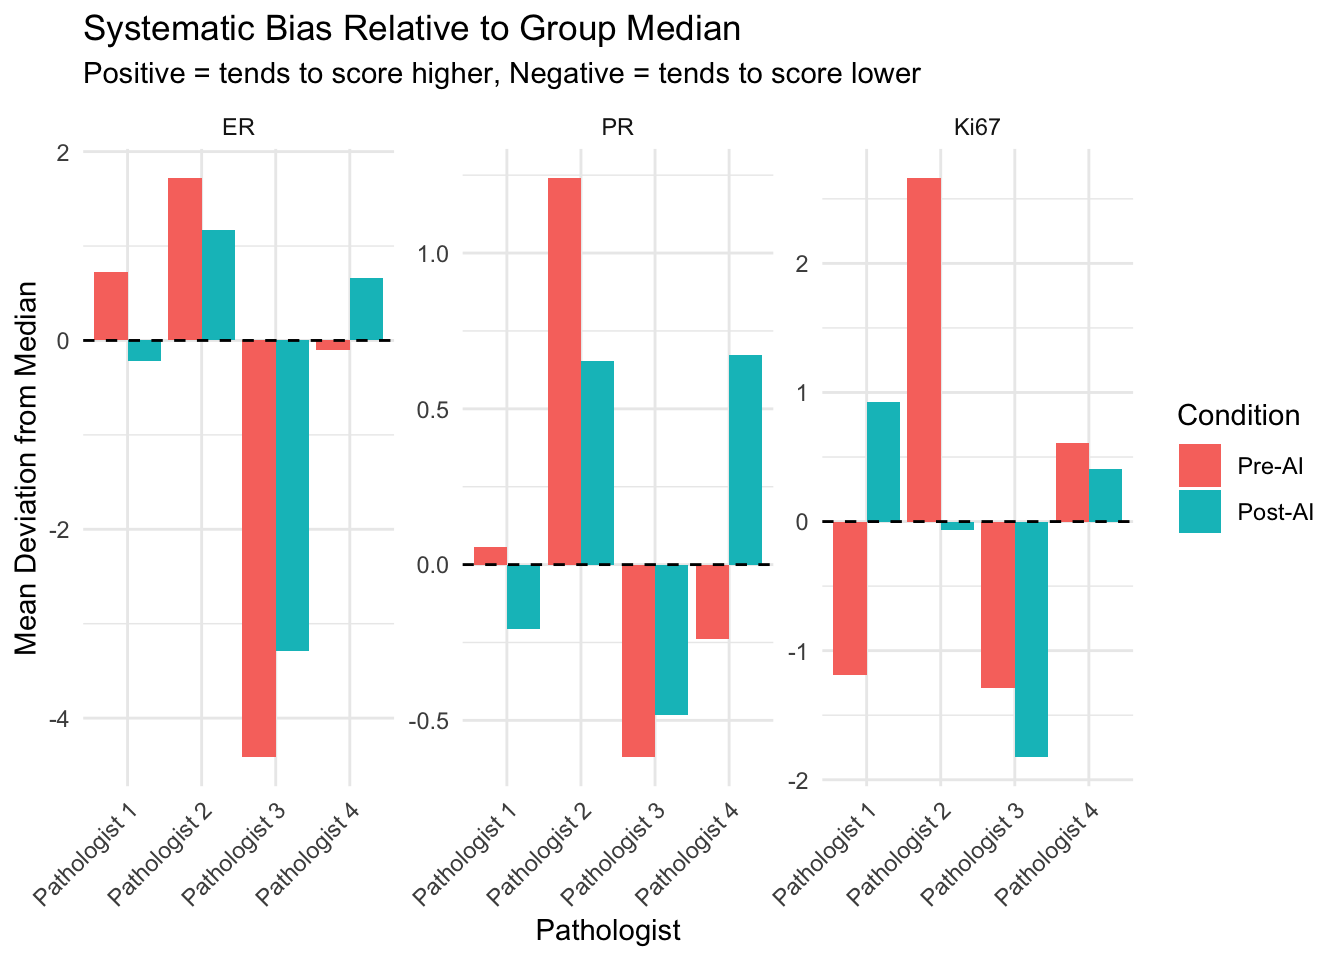
Systematic Biases: Individual pathologists may consistently score higher or lower than the group median for certain markers.
Marker-Specific Patterns: Pathologists may show different levels of expertise or consistency across different biomarkers.
Implications
- Seniority-tailored implementation: Junior pathologists may benefit from AI as a training tool, while senior pathologists may use it as a quality check
- Targeted training may be beneficial for pathologists with specific patterns
- Understanding individual adoption patterns can inform AI implementation strategies
- Quality assurance should account for individual variability
- Pathologists with high consistency but low AI influence may benefit from feedback
- Those with high AI influence but low consistency may need additional training
Wu, Si, Meng Yue, Jun Zhang, Xiaoxian Li, Zaibo Li, Huina Zhang, Xinran Wang, et al. 2023.
“The Role of Artificial Intelligence in Accurate Interpretation of HER2 Immunohistochemical Scores 0 and 1+ in Breast Cancer.” Modern Pathology 36 (3): 100054.
https://doi.org/10.1016/j.modpat.2022.100054.