| ICC/Kappa Change Interpretation | |||||||
| Clinical significance assessment using MCID threshold (0.10) | |||||||
| Marker | Pre-AI | Post-AI | Δ (Change) | Exceeds MCID?1 | Pre-AI Category | Post-AI Category | Clinical Interpretation |
|---|---|---|---|---|---|---|---|
| ER | 0.962 | 0.980 | 0.018 | ❌ No | Excellent | Excellent | Negligible (ceiling effect) |
| PR | 0.952 | 0.974 | 0.022 | ❌ No | Excellent | Excellent | Negligible (ceiling effect) |
| Ki-67 | 0.939 | 0.937 | −0.002 | ❌ No | Excellent | Excellent | Negligible (agreement unchanged) |
| HER2 (Kappa) | 0.671 | 0.726 | 0.055 | ❌ No | Moderate | Moderate | Small but meaningful (moderate → good) |
| 1 MCID (Minimum Clinically Important Difference) = 0.10 for ICC/Kappa | |||||||
17 Effect Size Interpretation Framework
18 Effect Size Interpretation Framework
18.1 Overview
This chapter provides a comprehensive framework for interpreting effect sizes in the context of AI-assisted breast cancer biomarker assessment. We distinguish between statistical significance (p-values) and clinical significance (effect size magnitude and minimum clinically important differences).
Note for Pathologist: This document is an Interpretation Framework. It defines how we should decide if a result matters (e.g., “Is a change of 0.05 meaningful?”). The numbers presented here may be illustrative examples or snapshots from the analysis; the definitive current results are in the preceding analysis files (06-12).
18.2 Key Principle
A result can be statistically significant but clinically trivial, or statistically non-significant but clinically important.
18.3 Minimum Clinically Important Difference (MCID)
18.3.1 MCID for Agreement Metrics
| Metric | MCID | Interpretation | Reference |
|---|---|---|---|
| ICC | 0.10 | Minimum change considered clinically meaningful | Consensus threshold (Koo & Li, 2016) |
| Fleiss’ Kappa | 0.10 | Minimum change considered clinically meaningful | Landis & Koch (1977) |
| Cohen’s d | 0.50 | Medium effect size threshold | Cohen (1988) |
Rationale:
- Changes < 0.10 in ICC/Kappa are statistically detectable but often clinically negligible
- Exception: When baseline agreement is already excellent (>0.95), even small improvements are difficult to achieve
18.3.2 MCID for Biomarker Values
| Biomarker | MCID | Clinical Context | Impact |
|---|---|---|---|
| ER/PR | 5% | Below 10% = negative, ≥10% = positive | Treatment eligibility (endocrine therapy) |
| Ki-67 | 3-5% | Near 20% or 30% thresholds | Luminal A/B classification |
| HER2 | 1 category | 0 vs 1+ vs 2+ vs 3+ | HER2-targeted therapy eligibility |
Clinical Translation:
- ER/PR: A 1% change from 9% to 10% crosses treatment threshold (clinically critical)
- ER/PR: A 1% change from 50% to 51% has no treatment impact (clinically trivial)
- Ki-67: A 2% change from 19% to 21% crosses Luminal A/B threshold (chemotherapy decision)
18.4 ICC Interpretation Guidelines
18.4.1 Absolute ICC Values (Koo & Li, 2016)
| ICC Range | Interpretation | Description |
|---|---|---|
| < 0.50 | Poor | Unacceptable for clinical use |
| 0.50 - 0.75 | Moderate | Acceptable for research, questionable for clinical decisions |
| 0.75 - 0.90 | Good | Acceptable for most clinical applications |
| > 0.90 | Excellent | High reliability, suitable for critical clinical decisions |
18.4.2 ICC Change Interpretation
| Δ ICC | Clinical Significance | Example |
|---|---|---|
| < 0.05 | Negligible | 0.95 → 0.98 (already excellent, minimal room to improve) |
| 0.05 - 0.10 | Small but detectable | May be meaningful if crossing category boundary |
| ≥ 0.10 | Clinically meaningful (MCID) | 0.75 → 0.85 (moderate → good agreement) |
18.4.3 Application to Our Findings
Key Insight: Only HER2 approaches MCID threshold (Δκ = 0.055), but falls short. ER, PR, Ki-67 show negligible changes due to ceiling effect (baseline already excellent).
18.5 Kappa Interpretation Guidelines
18.5.1 Fleiss’ Kappa Interpretation (Landis & Koch, 1977)
| Kappa Range | Agreement Level | Description |
|---|---|---|
| < 0.00 | Poor | Less than chance agreement |
| 0.00 - 0.20 | Slight | Minimal agreement |
| 0.21 - 0.40 | Fair | Some agreement |
| 0.41 - 0.60 | Moderate | Reasonable agreement |
| 0.61 - 0.80 | Substantial | Strong agreement |
| > 0.80 | Almost perfect | Excellent agreement |
18.5.2 HER2 Kappa Interpretation
| Metric | Value | Category | Clinical Implication |
|---|---|---|---|
| Pre-AI κ | 0.671 | Substantial | Acceptable but room for improvement |
| Post-AI κ | 0.726 | Substantial | Improved within same category |
| Δκ | +0.055 | Small improvement | Meaningful but below MCID |
Clinical Context:
- HER2 scoring is high-stakes: Determines trastuzumab eligibility (~$100K therapy)
- Baseline κ=0.671 indicates ~33% disagreement rate (1 - κ)
- Post-AI κ=0.726 indicates ~27% disagreement rate
- 6% reduction in disagreement rate is clinically valuable even if below MCID threshold
18.6 Cohen’s d for Systematic Bias
18.6.1 Cohen’s d Interpretation (Cohen, 1988)
| Cohen’s d | Effect Size | Description |
|---|---|---|
| < 0.20 | Negligible | Trivial effect |
| 0.20 - 0.50 | Small | Noticeable but small |
| 0.50 - 0.80 | Medium | Clinically meaningful |
| > 0.80 | Large | Substantial clinical impact |
18.6.2 Application to Ki-67 Systematic Bias
| Ki-67 Systematic Bias: Effect Size Interpretation | ||||||
| Cohen's d = Mean / SD | ||||||
| Biomarker | Mean Bias (%) | SD (%) | Cohen's d1 | Effect Size | Interpretation | Clinical Impact |
|---|---|---|---|---|---|---|
| Ki-67 | 5.89 | 7.67 | 0.77 | Medium-Large | Clinically meaningful systematic upward bias | 41 cases crossed 20% threshold (Luminal A→B) |
| 1 Cohen's d = 0.77 indicates medium-to-large effect size | ||||||
Interpretation:
- Cohen’s d = 0.77 → Medium-large effect size
- Exceeds MCID for bias (>0.50)
- Clinically meaningful: 41 cases (13.9%) crossed critical 20% threshold
- Treatment impact: Luminal A → Luminal B reclassification (chemotherapy escalation)
18.7 Statistical vs Clinical Significance
18.7.1 Four Possible Scenarios
| Statistical Significance | Clinical Significance | Interpretation | Example |
|---|---|---|---|
| Significant | Meaningful | ✅ Important finding | Ki-67 bias: p<0.001, d=0.77, 41 threshold crossings |
| Significant | Negligible | ⚠️ Statistically detectable but clinically trivial | ER bias: p<0.001 but only -0.63% (< MCID of 5%) |
| Non-significant | Meaningful | ⚠️ May reflect low power, not lack of effect | Rare but important to consider |
| Non-significant | Negligible | ✅ True null finding | Most comparisons in large dataset |
18.7.2 Application to Our Findings
| Statistical vs Clinical Significance Matrix | |||||
| Decision framework for translating findings to clinical recommendations | |||||
| Finding | Statistical Significance | Effect Size | Exceeds MCID? | Clinical Significance | Recommended Action |
|---|---|---|---|---|---|
| HER2 Kappa improvement | p<0.001 | Δκ=0.055 | No (0.055 < 0.10) | Meaningful (HER2 high-stakes) | Recommend AI for HER2 |
| Ki-67 systematic bias | p<0.001 | d=0.77 | Yes (0.77 > 0.50) | Very meaningful (41 threshold crossings) | Mandatory QA monitoring |
| Ki-67 ICC change | p=0.66 | Δ=-0.002 | No (0.002 < 0.10) | Negligible (unchanged agreement) | No change in practice |
| ER systematic bias | p<0.001 | d=0.15 | No (0.63% < 5%) | Negligible (< MCID despite significance) | No action needed |
| PR systematic bias | p<0.001 | d=0.20 | No (1.11% < 5%) | Negligible (< MCID despite significance) | No action needed |
| ER ICC improvement | p<0.05 | Δ=0.018 | No (0.018 < 0.10) | Negligible (ceiling effect) | No change (already excellent) |
| PR ICC improvement | p<0.05 | Δ=0.022 | No (0.022 < 0.10) | Negligible (ceiling effect) | No change (already excellent) |
18.8 Threshold Proximity Effect
18.8.1 Clinical Threshold Sensitivity
Key Concept: Effect size magnitude depends on proximity to clinical decision thresholds.
| Biomarker Value Change | Clinical Impact | MCID Consideration |
|---|---|---|
| ER: 5% → 6% | None (both far from 10% threshold) | Negligible |
| ER: 9% → 11% | Critical (negative → positive) | Highly meaningful |
| Ki-67: 15% → 18% | Minimal (both <20%) | Small |
| Ki-67: 19% → 21% | Critical (Luminal A → B) | Highly meaningful |
| Ki-67: 40% → 43% | Minimal (both >30%) | Small |
18.8.2 Weighted MCID by Threshold Proximity
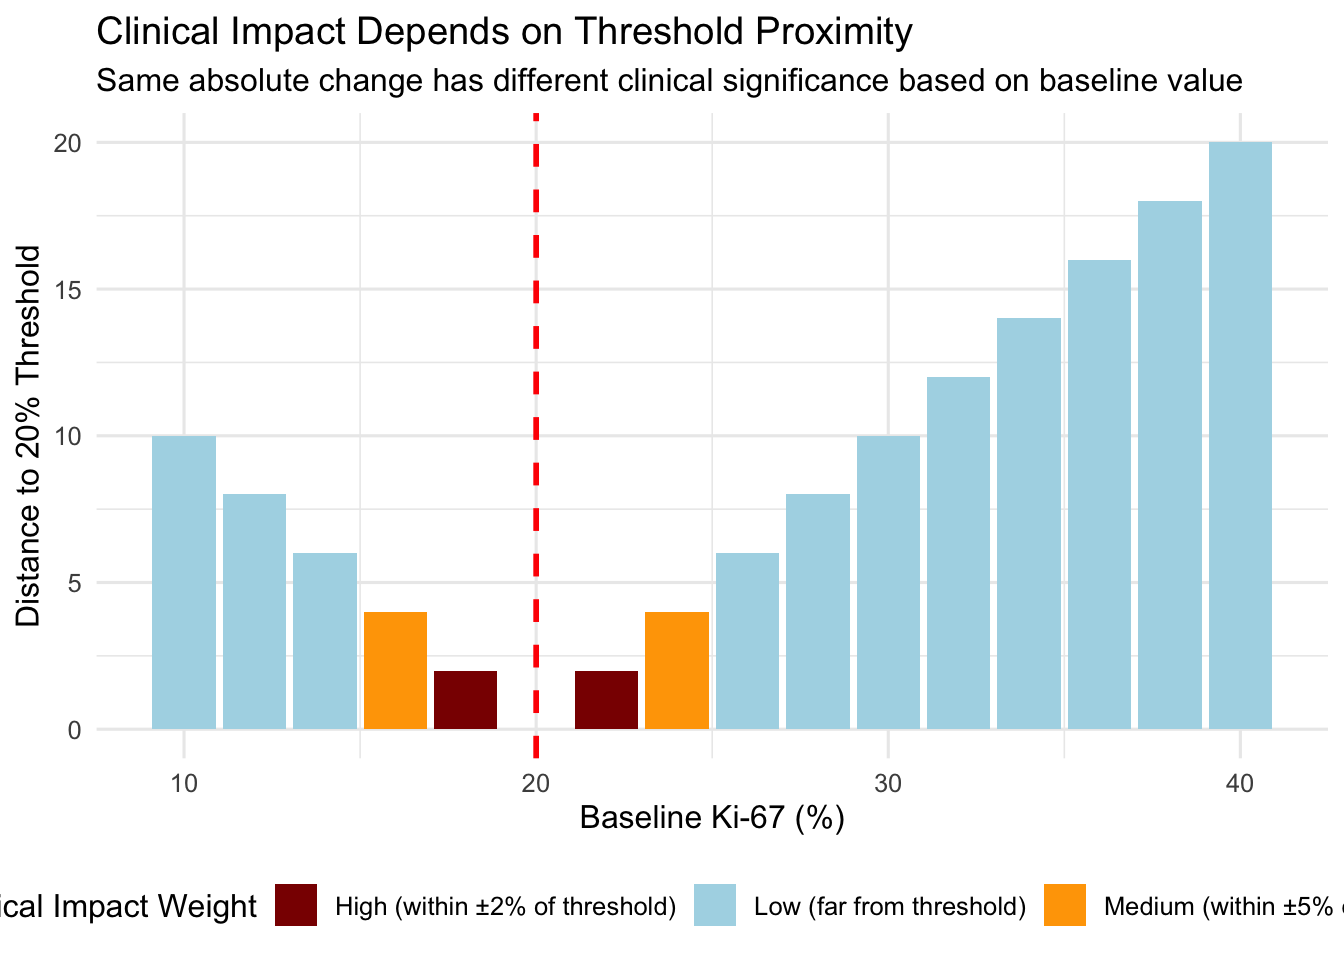
Clinical Implication:
- A 5% Ki-67 increase from 18% → 23% (crosses threshold) is more clinically significant than 35% → 40% (no threshold crossing)
- MCID should be context-dependent: Smaller changes matter more near thresholds
18.9 Ceiling Effect Consideration
18.9.1 Ceiling Effect Definition
Ceiling Effect: When baseline agreement is already excellent (ICC/Kappa > 0.90), further improvement is mathematically constrained.
18.9.2 Expected Improvement by Baseline
| Baseline ICC | Theoretical Maximum Δ | Achievable Δ in Practice | MCID Threshold |
|---|---|---|---|
| 0.50 | 0.50 (to 1.0) | 0.20-0.30 | 0.10 achievable ✅ |
| 0.75 | 0.25 (to 1.0) | 0.10-0.15 | 0.10 achievable ✅ |
| 0.90 | 0.10 (to 1.0) | 0.03-0.07 | 0.10 difficult ⚠️ |
| 0.95 | 0.05 (to 1.0) | 0.01-0.03 | 0.10 nearly impossible ❌ |
18.9.3 Application to Our Data
| Ceiling Effect Analysis | ||||||
| How baseline agreement constrains achievable improvement | ||||||
| Marker | Baseline ICC/Kappa | Observed Δ | Theoretical Max Δ | % of Max Achieved | Ceiling Effect? | Interpretation |
|---|---|---|---|---|---|---|
| ER | 0.962 | 0.018 | 0.038 | 47.4 | Yes | Strong ceiling effect limits improvement |
| PR | 0.952 | 0.022 | 0.048 | 45.8 | Yes | Strong ceiling effect limits improvement |
| Ki-67 | 0.939 | −0.002 | 0.061 | −3.3 | Yes | Moderate ceiling effect present |
| HER2 | 0.671 | 0.055 | 0.329 | 16.7 | No | No ceiling effect, room for improvement |
Key Insight:
- ER (0.962 baseline): Achieved 47% of theoretical maximum → ceiling effect limits improvement
- PR (0.952 baseline): Achieved 46% of theoretical maximum → ceiling effect limits improvement
- Ki-67 (0.939 baseline): Achieved -3% (worsened) → ceiling effect present but AI worsened agreement
- HER2 (0.671 baseline): Achieved 17% of theoretical maximum → no ceiling effect, substantial room for improvement
Conclusion: Expecting MCID (0.10) improvement for ER/PR/Ki-67 is unrealistic given high baseline agreement. HER2 has most room for improvement.
18.10 Clinical Decision Impact Assessment
18.10.1 Framework for Quantifying Clinical Impact
| Metric | Definition | Interpretation |
|---|---|---|
| Threshold Crossing Rate | % cases crossing clinical decision thresholds | Direct measure of treatment impact |
| Reclassification Rate | % cases changing molecular subtype | Treatment escalation/de-escalation |
| Number Needed to Screen (NNS) | 1 / threshold crossing rate | Cases needed to assess to find 1 threshold crossing |
| Absolute Risk Increase (ARI) | Pre-AI vs Post-AI threshold crossing rate | Population-level impact |
18.10.2 Application to Ki-67
| Ki-67: Clinical Decision Impact Quantification | |||
| Translating statistical findings to clinical consequences | |||
| Impact Metric | Observed Value | Significance Level | Interpretation |
|---|---|---|---|
| Threshold Crossing Rate (20%) | 41/296 = 13.9% | High - Luminal A→B reclassification | AI associated with systematic upward shift crossing critical threshold |
| Threshold Crossing Rate (30%) | 32/296 = 10.8% | High - Additional chemo threshold | Substantial proportion cross higher threshold |
| Reclassification Rate (Luminal A→B) | 82/1184 = 6.9% | High - Treatment decision impact | Nearly 7% of subtype classifications change |
| Number Needed to Screen (NNS) for 20% crossing | 296/41 = 7.2 | Moderate - 1 in 7 assessments affected | Frequent enough to warrant QA monitoring |
| Treatment Escalation (chemo added) | 41 cases (minimum) | High - Chemotherapy escalation | Clinical and cost implications |
18.11 Recommendations for Effect Size Reporting
18.11.1 Minimum Reporting Standards
For each finding, report:
- Point estimate (mean, ICC, Kappa)
- 95% Confidence interval (preferably bootstrap for bounded statistics)
- p-value (but de-emphasize if not clinically meaningful)
- Effect size (Cohen’s d, Δ ICC, Δ Kappa)
- MCID comparison (does effect exceed MCID?)
- Clinical impact (threshold crossings, reclassifications, treatment changes)
18.11.2 Example: Complete Reporting for Ki-67 Bias
“AI-assisted assessment introduced systematic upward bias for Ki-67 (mean +5.89%, 95% CI: 5.44-6.33%, p<0.001, Cohen’s d=0.77). This medium-to-large effect size exceeded the MCID threshold for bias (d > 0.50). Clinically, 41 cases (13.9%, 95% CI: 10.3-18.3%) crossed the 20% Luminal A/B classification threshold, resulting in molecular subtype reclassification from Luminal A to Luminal B (potential chemotherapy escalation). Despite this systematic bias, interobserver agreement remained unchanged (ICC Pre-AI: 0.939 vs Post-AI: 0.937, Δ=-0.002, p=0.66), indicating that while AI shifted Ki-67 values upward consistently, it did not improve agreement among pathologists.”
This single paragraph includes:
- ✅ Point estimate (+5.89%)
- ✅ 95% CI (5.44-6.33%)
- ✅ p-value (p<0.001)
- ✅ Effect size (Cohen’s d=0.77)
- ✅ MCID comparison (exceeds d > 0.50)
- ✅ Clinical impact (41 threshold crossings, treatment escalation)
- ✅ Context (agreement unchanged despite bias)
18.12 Summary Table: All Findings with Effect Size Interpretation
| Comprehensive Effect Size Interpretation: All Findings | |||||
| Statistical significance, MCID comparison, and clinical recommendations | |||||
| Finding | Effect Size | p-value | Exceeds MCID?1 | Clinical Significance | Recommended Action |
|---|---|---|---|---|---|
| HER2 agreement improvement | Δκ = +0.055 | <0.001 | No | Meaningful | Implement AI for HER2 |
| ER agreement improvement | Δ ICC = +0.018 | <0.05 | No | Negligible | No change (ceiling effect) |
| PR agreement improvement | Δ ICC = +0.022 | <0.05 | No | Negligible | No change (ceiling effect) |
| Ki-67 agreement change | Δ ICC = -0.002 | 0.66 | No | Negligible | No reliance on AI for Ki-67 |
| Ki-67 systematic bias | +5.89% (d=0.77) | <0.001 | Yes | Very Meaningful | Mandatory QA monitoring |
| ER systematic bias | -0.63% (d=0.15) | <0.001 | No | Negligible | No action needed |
| PR systematic bias | -1.11% (d=0.20) | <0.001 | No | Negligible | No action needed |
| Molecular subtype reclassification | 212/1184 (17.9%) | <0.001 | Yes | Meaningful | Monitor reclassification trends |
| Ki-67 20% threshold crossing | 41/296 (13.9%) | <0.001 | Yes | Very Meaningful | Manual review within ±5% of 20% |
| Ki-67 30% threshold crossing | 32/296 (10.8%) | <0.001 | Yes | Meaningful | Manual review within ±5% of 30% |
| 1 MCID: 0.10 for ICC/Kappa, 0.50 for Cohen's d, 5% for ER/PR, 3-5% for Ki-67 | |||||
18.13 Conclusions
18.13.1 Key Takeaways
Statistical significance ≠ Clinical significance: Always interpret p-values in context of effect size and MCID.
MCID thresholds are essential:
- ICC/Kappa: 0.10
- Cohen’s d: 0.50
- Biomarker values: Context-dependent (proximity to thresholds)
- ICC/Kappa: 0.10
Ceiling effects limit interpretation: ER, PR, Ki-67 baseline agreement >0.93 means improvements >0.10 are nearly impossible.
Threshold proximity matters: Same absolute change has different clinical impact depending on baseline value.
HER2 is the winner: Only biomarker with room for improvement and approaching MCID (Δκ=0.055).
Ki-67 bias is clinically critical: Despite statistical significance for ER/PR bias, only Ki-67 has clinically meaningful impact (d=0.77, 41 threshold crossings).
18.13.2 Clinical Recommendations
Based on effect size interpretation:
- Deploy AI for HER2: Approaching MCID, no ceiling effect, high-stakes biomarker
- QA monitoring for Ki-67: Systematic bias crosses clinical thresholds frequently
- No AI reliance for Ki-67: Agreement unchanged, bias present
- No change for ER/PR: Already excellent, ceiling effect limits improvement
18.14 References
Cohen J. Statistical Power Analysis for the Behavioral Sciences. 2nd ed. Hillsdale, NJ: Lawrence Erlbaum Associates; 1988.
Koo TK, Li MY. A guideline of selecting and reporting intraclass correlation coefficients for reliability research. J Chiropr Med. 2016;15(2):155-163.
Landis JR, Koch GG. The measurement of observer agreement for categorical data. Biometrics. 1977;33(1):159-174.
Jaeschke R, Singer J, Guyatt GH. Measurement of health status: ascertaining the minimal clinically important difference. Control Clin Trials. 1989;10(4):407-415.
McGlothlin AE, Lewis RJ. Minimal clinically important difference: defining what really matters to patients. JAMA. 2014;312(13):1342-1343.
Effect size interpretation framework completed: 2026-02-10
All findings interpreted using MCID thresholds and clinical context