[1] "Filtered to common cohort. Merged N: 1184"[1] "Before NA removal: 1184"[1] "After NA removal: 1037"Detect and quantify systematic biases in AI and pathologist assessments.
Note for Pathologist: Systematic bias means “always missing in the same direction”. For example, does the AI always underestimate Ki67 in high-grade tumors? Or does it always score ER higher than humans? Detecting these biases allows us to “calibrate” our expectations - if we know the AI runs high, we can mentally adjust.
[1] "Filtered to common cohort. Merged N: 1184"[1] "Before NA removal: 1184"[1] "After NA removal: 1037"Does AI systematically over or underestimate compared to pathologists’ initial assessments?
| Overall AI Bias | ||||
| Mean and median differences (Post-AI minus Pre-AI) | ||||
| Marker | Mean Bias1 | Median Bias | SD of Bias | NA |
|---|---|---|---|---|
| er | −0.76 | 0.00 | 6.39 | — |
| pr | −1.23 | 0.00 | 7.62 | — |
| ki67 | 5.88 | 4.00 | 7.69 | — |
| n | — | — | — | 1037 |
| 1 Positive values = AI tends to give higher scores | ||||
| Statistical Tests for Systematic Bias | |||||
| Paired t-tests: H0 = no difference between Pre and Post | |||||
| Marker | Mean Difference | t-statistic | P-value | 95% CI Lower | 95% CI Upper |
|---|---|---|---|---|---|
| ER | −0.764 | −3.846 | 0.0001 | −1.153 | −0.374 |
| PR | −1.226 | −5.176 | 0.0000 | −1.690 | −0.761 |
| Ki67 | 5.884 | 24.642 | 0.0000 | 5.416 | 6.353 |
Test if AI bias varies by the initial score level (e.g., more bias for low vs high scores).
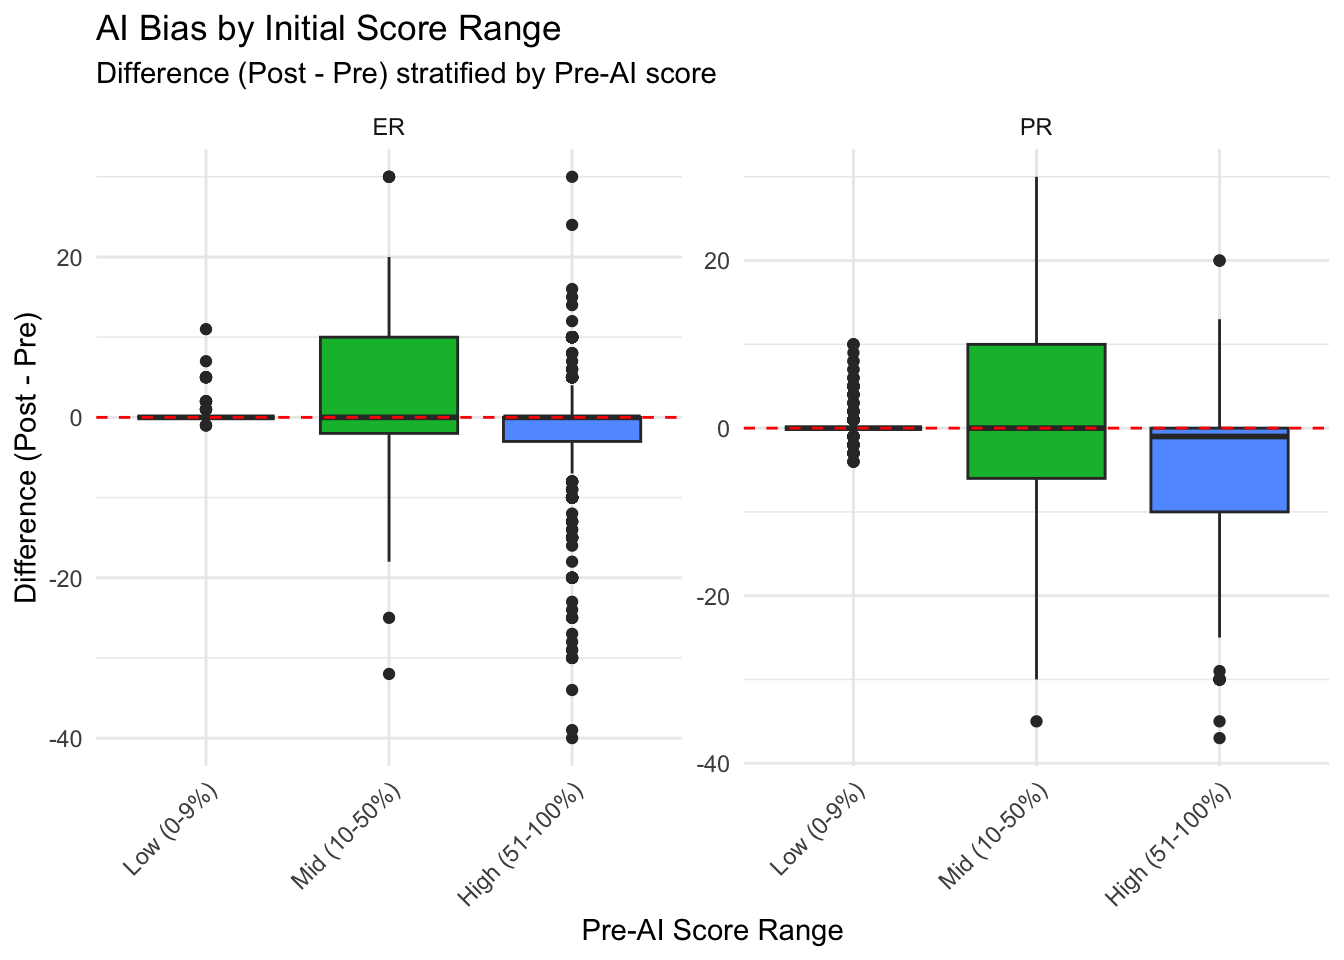
| ANOVA: Bias Variation by Score Range | ||
| Test if AI bias differs across score ranges | ||
| Marker | F-statistic | P-value |
|---|---|---|
| ER | 10.72 | 0.0000 |
| PR | 56.61 | 0.0000 |
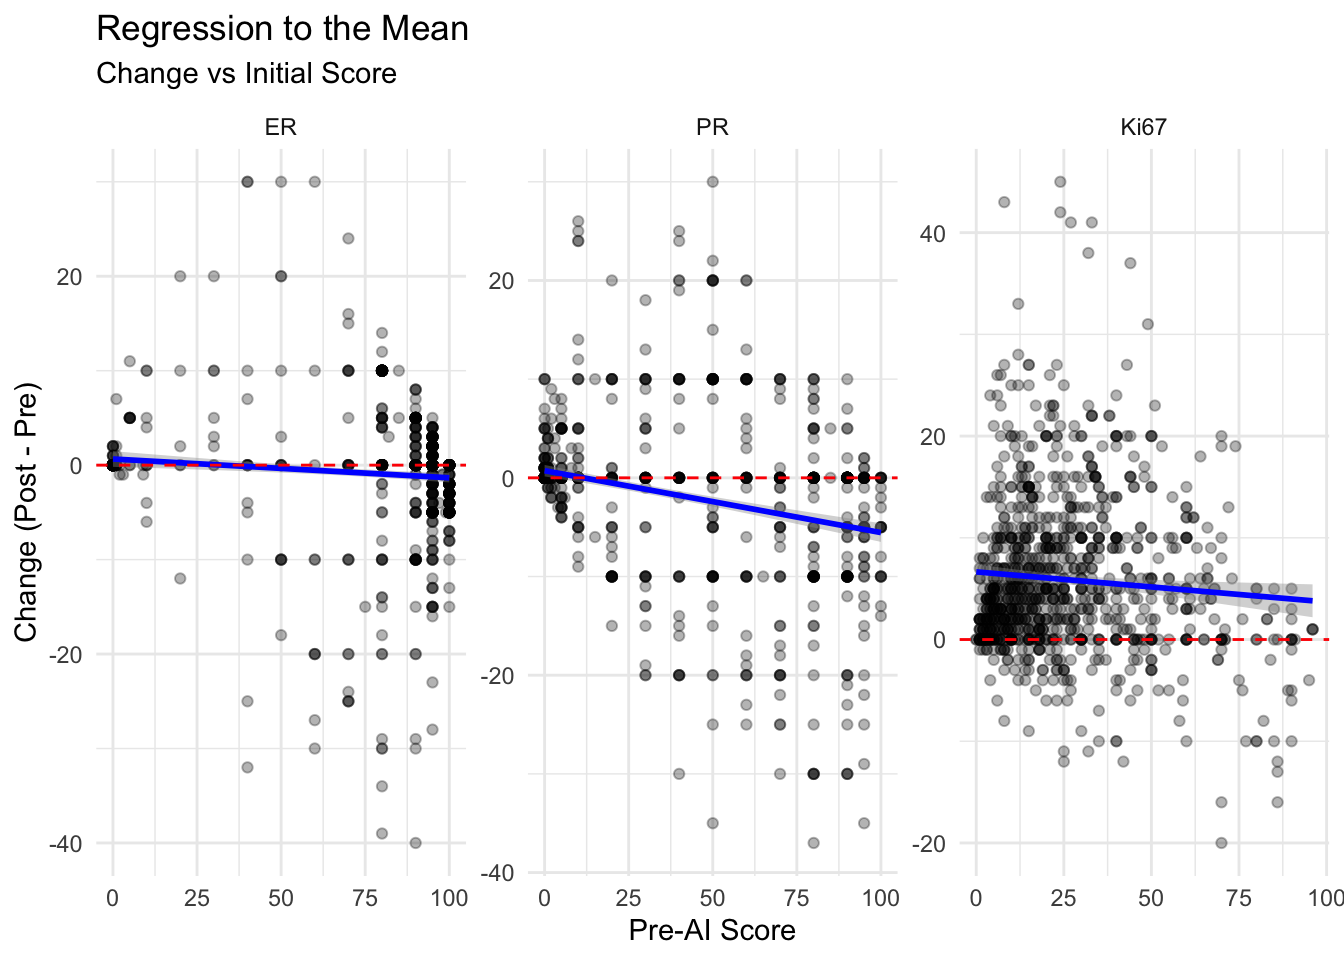
Test if AI shows regression to the mean (extreme values become more moderate).
| Regression to the Mean Analysis | ||||
| Relationship between initial score and change | ||||
| Marker | Slope (β)1 | SE | t-value | P-value |
|---|---|---|---|---|
| ER | −0.0199 | 0.0053 | −3.7706 | 0.00017 |
| PR | −0.0627 | 0.0062 | −10.1466 | 0.00000 |
| Ki67 | −0.0296 | 0.0112 | −2.6327 | 0.00860 |
| 1 Negative slope = regression to mean (high values decrease, low values increase) | ||||
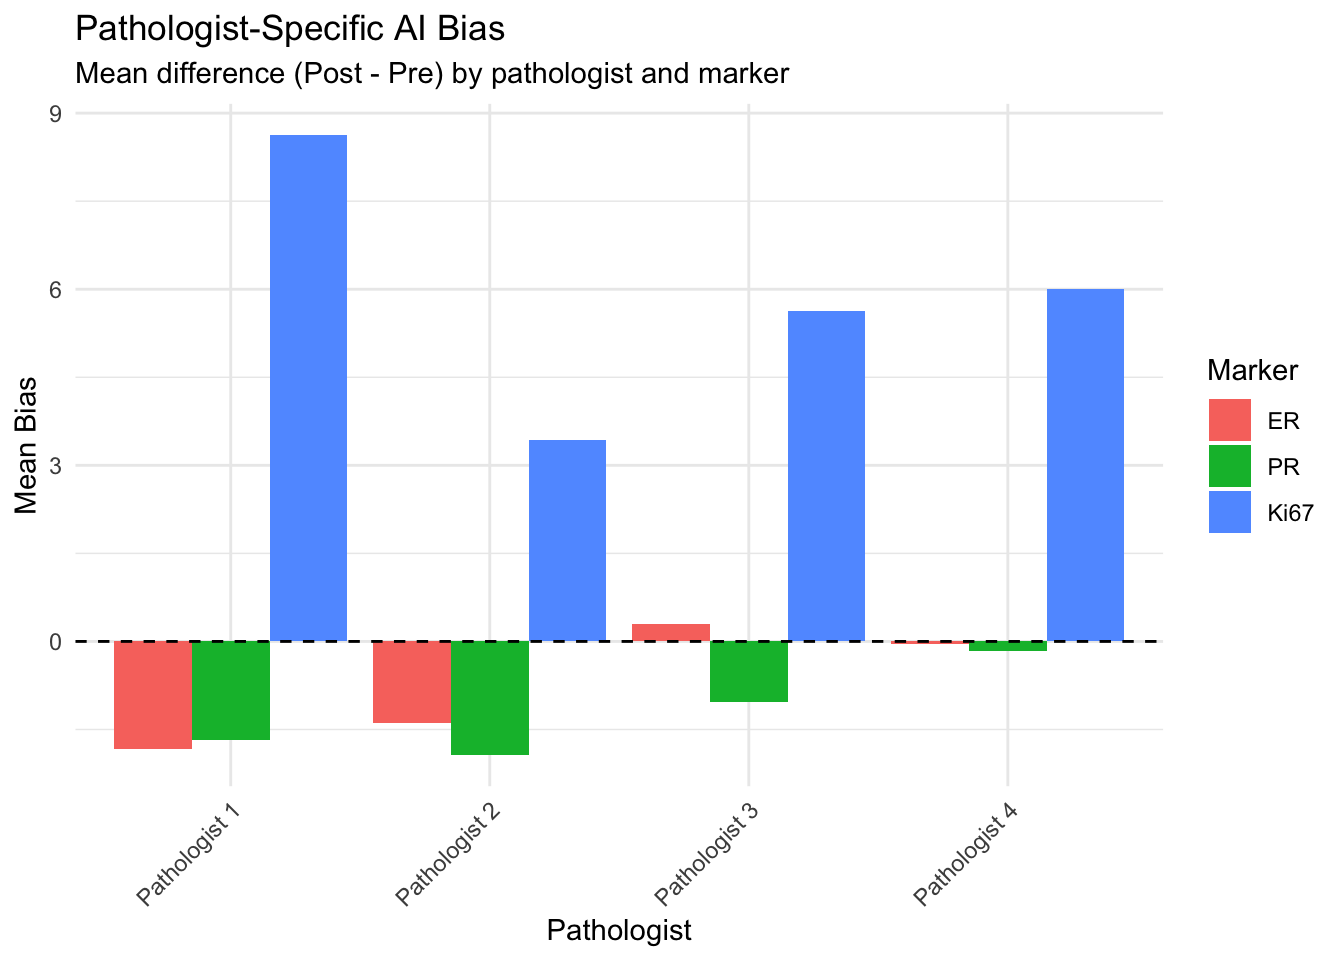
Compare systematic biases across pathologists.
| Pathologist-Specific Bias | |||
| Mean change after AI by pathologist | |||
| Pathologist | ER Bias | PR Bias | Ki67 Bias |
|---|---|---|---|
| Pathologist 1 | −1.83 | −1.69 | 8.63 |
| Pathologist 2 | −1.38 | −1.94 | 3.43 |
| Pathologist 3 | 0.29 | −1.03 | 5.62 |
| Pathologist 4 | −0.05 | −0.16 | 6.00 |
Analyze directional bias in HER2 scoring.
| HER2 Score Changes | ||
| Overall directional patterns | ||
| Change Direction | Count | Percentage (%) |
|---|---|---|
| Downgraded | 56 | 5.4 |
| No Change | 938 | 90.5 |
| Upgraded | 43 | 4.1 |
| HER2 Changes by Pathologist | ||||
| Distribution of upgrades, downgrades, and no changes | ||||
| Downgraded | No Change | Upgraded | Net Change | Total Cases |
|---|---|---|---|---|
| Pathologist 1 | ||||
| 8 | 237 | 14 | 6 | 259 |
| Pathologist 2 | ||||
| 30 | 230 | 15 | -15 | 275 |
| Pathologist 3 | ||||
| 12 | 231 | 9 | -3 | 252 |
| Pathologist 4 | ||||
| 6 | 240 | 5 | -1 | 251 |
| Most Common HER2 Transitions | |||
| Top 10 score change patterns | |||
| Pre-AI Score | Post-AI Score | Direction | Count |
|---|---|---|---|
| 1 | 1 | No Change | 384 |
| 0 | 0 | No Change | 293 |
| 2 | 2 | No Change | 137 |
| 3 | 3 | No Change | 124 |
| 2 | 1 | Downgraded | 44 |
| 0 | 1 | Upgraded | 24 |
| 1 | 2 | Upgraded | 16 |
| 1 | 0 | Downgraded | 10 |
| 2 | 3 | Upgraded | 3 |
| 3 | 2 | Downgraded | 2 |
Examine if bias is stronger near clinically important thresholds.
| AI Influence Near Clinical Thresholds | |||||
| Mean absolute change within 5% of threshold vs away from threshold | |||||
| Marker | Threshold | Near Threshold | Far from Threshold | Difference | Ratio1 |
|---|---|---|---|---|---|
| ER | 1% | 0.33 | 3.76 | −3.43 | 0.09 |
| ER | 10% | 4.05 | 3.09 | 0.96 | 1.31 |
| PR | 1% | 0.54 | 7.40 | −6.86 | 0.07 |
| PR | 10% | 3.58 | 4.05 | −0.47 | 0.88 |
| Ki67 | 20% | 7.81 | 6.60 | 1.21 | 1.18 |
| Ki67 | 30% | 8.61 | 6.55 | 2.06 | 1.32 |
| 1 Ratio > 1 = More AI influence near thresholds | |||||
Classic method for assessing agreement and detecting systematic bias.
Note: The Bland-Altman analysis below pools observations across all four pathologists. This approach captures overall pre-vs-post bias but conflates within-pathologist change with between-pathologist variation, potentially widening the limits of agreement. Per-pathologist Bland-Altman plots are available in the individual pathologist performance analysis (Chapter 7).
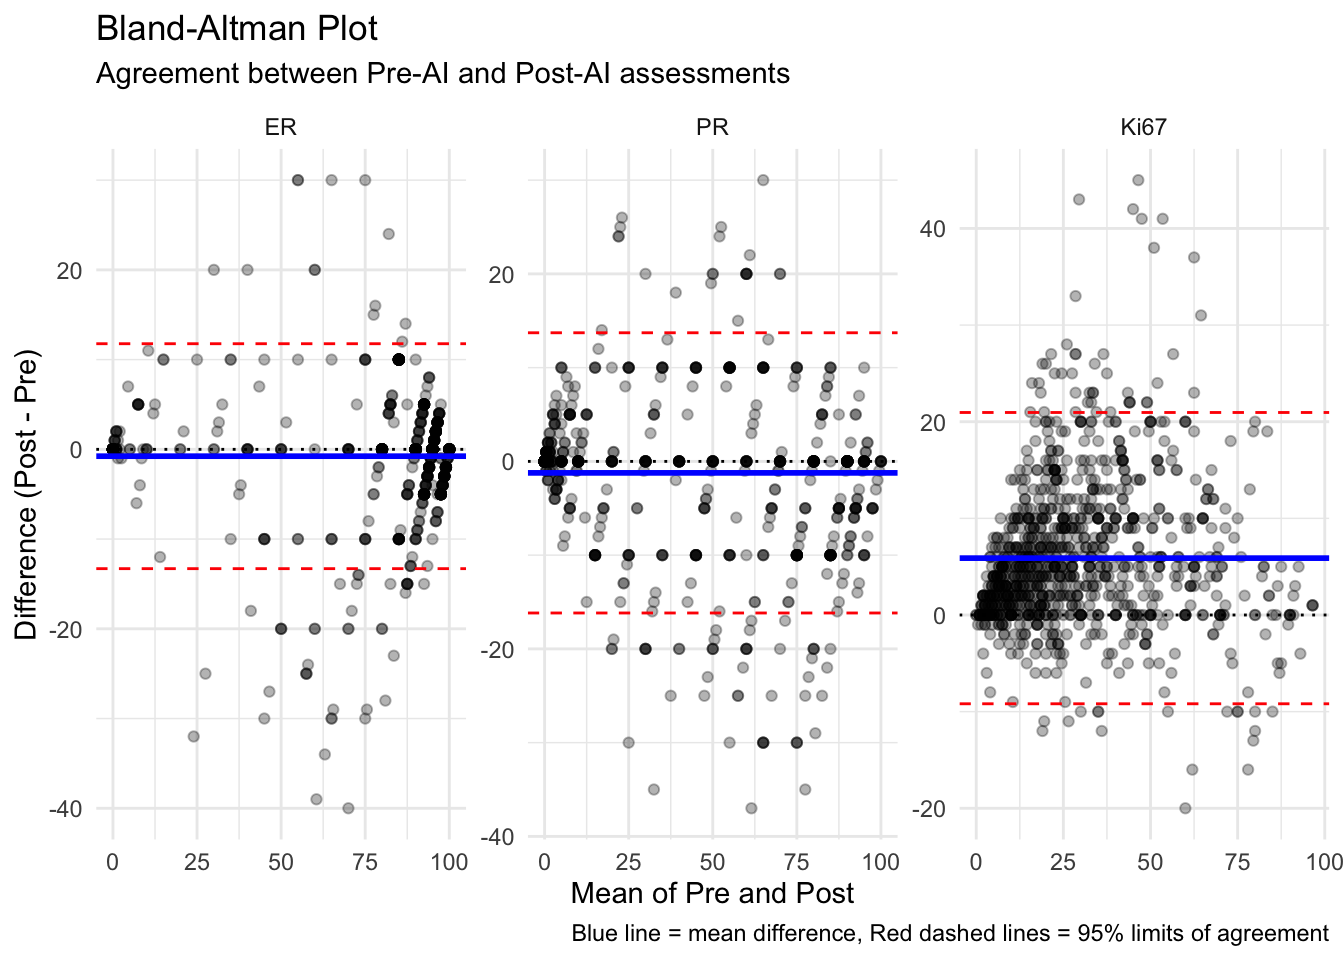
| Bland-Altman Statistics | ||||
| Mean difference and 95% limits of agreement | ||||
| Marker | Mean Difference | SD of Differences | Upper LoA | Lower LoA |
|---|---|---|---|---|
| ER | −0.76 | 6.39 | 11.77 | −13.30 |
| PR | −1.23 | 7.62 | 13.72 | −16.17 |
| Ki67 | 5.88 | 7.69 | 20.96 | −9.19 |
Overall Bias: Quantifies whether AI systematically shifts scores up or down
Range-Dependent Bias: AI may show different bias patterns for low vs high scores
Regression to the Mean: Extreme values tend to become more moderate after AI input
Pathologist-Specific Patterns: Individual pathologists may show unique bias patterns when using AI
Threshold Effects: AI influence may be stronger near clinically important cutoffs
Bland-Altman Analysis: Visualizes agreement and identifies proportional bias