Dataset: 296 cases, 4 pathologists24 Literature Comparison & Extended Statistical Methods
24.1 Objective
Implement statistical methods from comparable published studies, generate directly comparable tables and figures, and systematically compare our findings with the literature on AI-assisted breast cancer biomarker assessment.
Note for Pathologist: This chapter applies the same statistical methods used in comparable published studies to our data, allowing direct “apples-to-apples” comparison. We compute Krippendorff’s alpha, noninferiority margins, confusion matrices, precision/recall/F1, and PI error analysis — all standard metrics in recent AI pathology publications.
24.2 Setup
24.3 Load Data
24.4 Section A: Krippendorff’s Alpha
Krippendorff’s alpha is used by Dy et al. (2024) (Ki67: 0.63 → 0.89 with AI) and Abele et al. (2023) (Ki67: 0.69 → 0.72; ER/PR: 0.91 → 0.94). It handles any number of raters, different measurement scales, and missing data.
Scale choice: We compute Krippendorff’s alpha using the
ratiomethod, which assumes ratio-scale data (meaningful zero, meaningful ratios). While ER%, PR%, and Ki-67% have a meaningful zero point, whether ratios are meaningful (e.g., is 80% ER “twice” 40% ER?) is debatable. As a sensitivity check, we also compute with theintervalmethod below. The difference is typically small for our data range.
24.4.1 Krippendorff’s Alpha Results
| Krippendorff's Alpha: Inter-Observer Reliability | ||||||
| Pre-AI vs Post-AI comparison with literature benchmarks | ||||||
| Marker | α (Pre-AI)1 | α (Post-AI) | N (Pre) | N (Post) | Δα2 | Scale |
|---|---|---|---|---|---|---|
| ER | 0.938 | 0.943 | 295 | 287 | 0.005 | Ratio |
| PR | 0.824 | 0.867 | 293 | 278 | 0.042 | Ratio |
| Ki67 | 0.849 | 0.843 | 291 | 282 | −0.006 | Ratio |
| HER2 | 0.853 | 0.865 | 229 | 226 | 0.012 | Ordinal |
| 1 α ≥ 0.80: acceptable; 0.67-0.80: tentative; < 0.67: unacceptable (Krippendorff, 2004) | ||||||
| 2 Dy et al.: Ki67 Δα = +0.26; Abele et al.: Ki67 Δα = +0.03 | ||||||
24.4.2 Sensitivity Check: Ratio vs Interval Scale
| Krippendorff's Alpha: Ratio vs Interval Scale Sensitivity | ||||
| Difference between ratio and interval methods | ||||
| Marker | Modality | α (Ratio) | α (Interval) | Difference |
|---|---|---|---|---|
| ER | Pre-AI | 0.938 | 0.962 | −0.024 |
| ER | Post-AI | 0.943 | 0.980 | −0.037 |
| PR | Pre-AI | 0.824 | 0.952 | −0.127 |
| PR | Post-AI | 0.867 | 0.974 | −0.107 |
| Ki67 | Pre-AI | 0.849 | 0.939 | −0.089 |
| Ki67 | Post-AI | 0.843 | 0.937 | −0.093 |
24.5 Section B: Noninferiority Testing
Abele et al. (2023) established noninferiority of AI-assisted analysis using agreement rates with a 95% logit CI and a noninferiority margin of 75%. We replicate this framework.
24.5.1 Noninferiority Results
| Noninferiority Analysis: Pre-AI vs Post-AI Agreement | |||||
| Noninferiority margin = 75% (per Abele et al., 2023) | |||||
| Marker (Cutoff) | Agreement (%)1 | 95% CI Lower | 95% CI Upper | N | Noninferiority |
|---|---|---|---|---|---|
| ER (≥1%) | 99.2 | 98.5 | 99.6 | 1175 | PASS |
| PR (≥1%) | 96.6 | 95.4 | 97.5 | 1159 | PASS |
| Ki67 (≥20%) | 85.6 | 83.5 | 87.5 | 1162 | PASS |
| HER2 (2+/3+) | 94.4 | 93.0 | 95.6 | 1184 | PASS |
| 1 Abele et al. (2023): Ki67 87.6%, ER/PR 89.4% | |||||
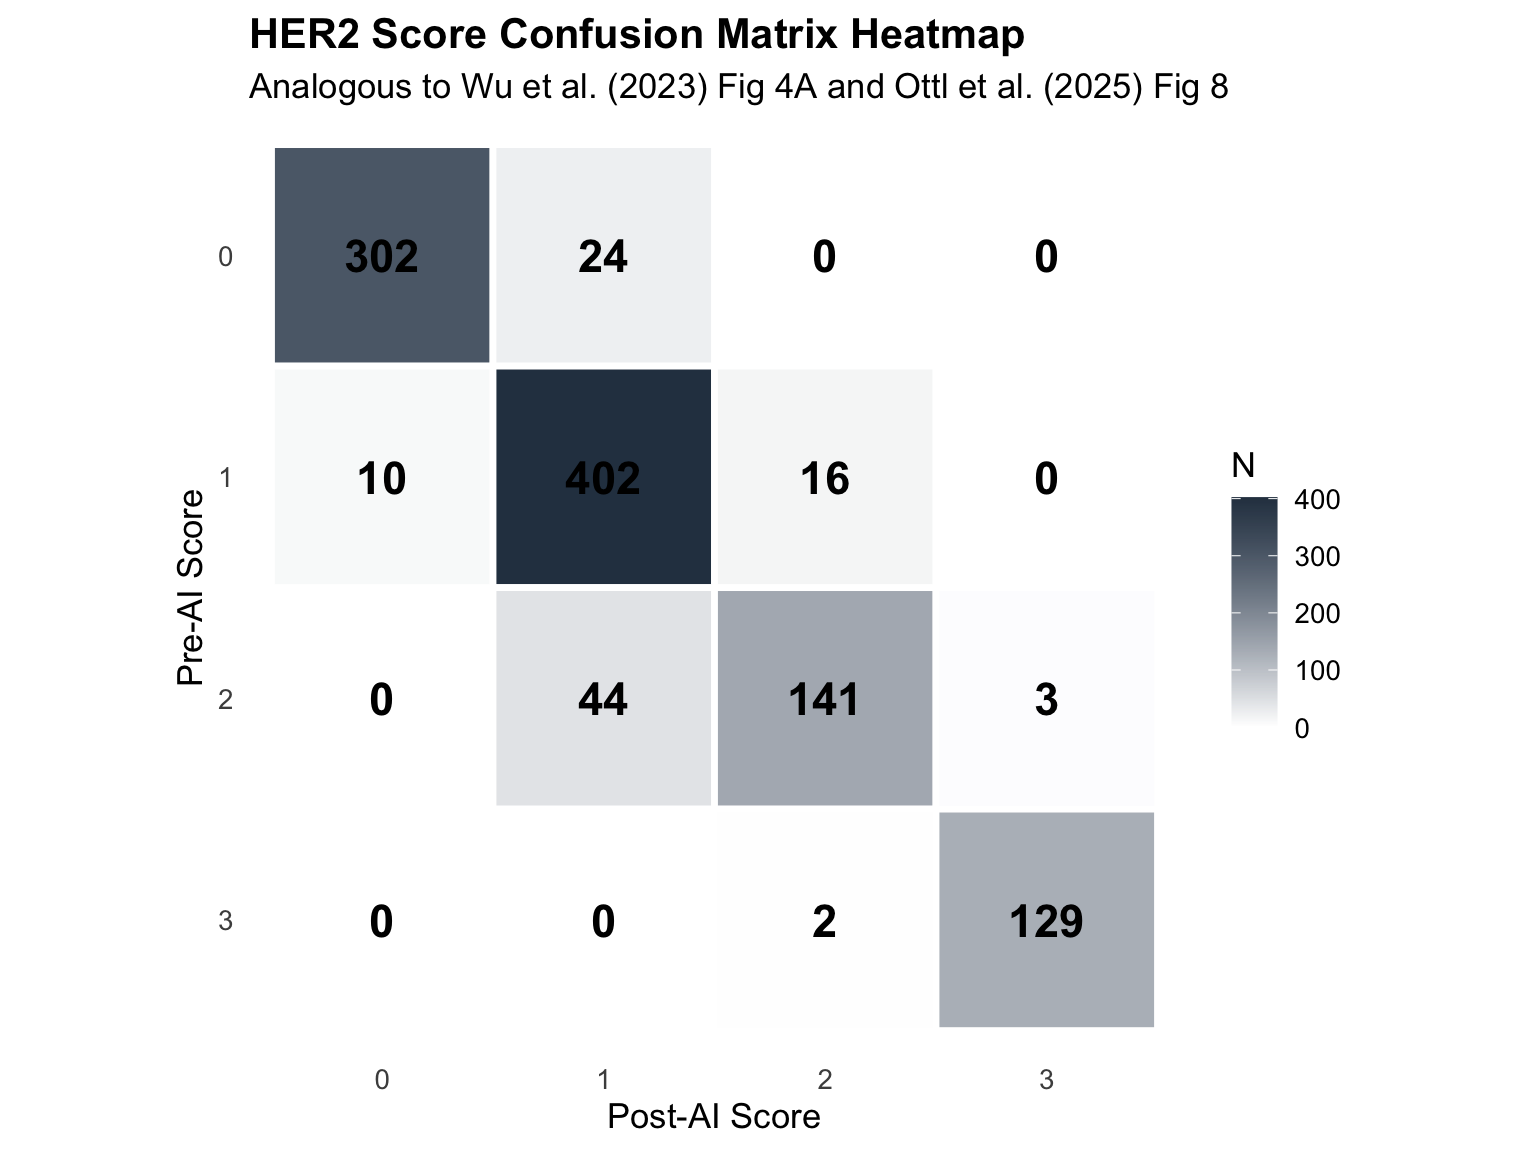
24.6 Section C: Confusion Matrices for HER2
Full HER2 score confusion matrices (0/1+/2+/3+) following the approach of Wu et al. (2023) and Krishnamurthy et al. (2024).
24.6.1 Aggregate Confusion Matrix
| HER2 Score Confusion Matrix (All Pathologists) | ||||
| Pre-AI (rows) vs Post-AI (columns) | ||||
| Pre-AI Score |
Post-AI Score
|
|||
|---|---|---|---|---|
| 0 | 1 | 2 | 3 | |
| 0 | 302 | 24 | 0 | 0 |
| 1 | 10 | 402 | 16 | 0 |
| 2 | 0 | 44 | 141 | 3 |
| 3 | 0 | 0 | 2 | 129 |
24.6.2 Confusion Matrix Heatmap
24.6.3 HER2 0 vs 1+ Confusion Matrix (Critical for HER2-Low)
| HER2 0 vs 1+ Confusion Matrix | ||
| Critical distinction for T-DXd eligibility (Wu et al., 2023) | ||
| Pre-AI |
Post-AI
|
|
|---|---|---|
| 0 | 1 | |
| 0 | 302 | 24 |
| 1 | 10 | 402 |
24.6.4 Accuracy, Precision, Recall, F1
| HER2 Score Classification Metrics (4-class)1 | |||||||
| Pre-AI as reference1 | |||||||
| Class | TP | FP | FN | Precision | Recall | F1 | Accuracy |
|---|---|---|---|---|---|---|---|
| 0 | 302 | 10 | 24 | 0.968 | 0.926 | 0.947 | 0.908 |
| 1 | 402 | 68 | 26 | 0.855 | 0.939 | 0.895 | 0.908 |
| 2 | 141 | 18 | 47 | 0.887 | 0.750 | 0.813 | 0.908 |
| 3 | 129 | 3 | 2 | 0.977 | 0.985 | 0.981 | 0.908 |
| 1 Wu et al. (2023): HER2 ICC 0.542 → 0.812; Krishnamurthy et al. (2024): agreement 69.7% → 77.2% | |||||||
| HER2 0 vs 1+ Classification Metrics (Binary) | |||||||
| Critical for T-DXd eligibility | |||||||
| Class | TP | FP | FN | Precision | Recall | F11 | Accuracy |
|---|---|---|---|---|---|---|---|
| 0 | 302 | 10 | 24 | 0.968 | 0.926 | 0.947 | 0.954 |
| 1 | 402 | 24 | 10 | 0.944 | 0.976 | 0.959 | 0.954 |
| 1 Wu et al. (2023): F1 0.78 → 0.93 with AI | |||||||
24.7 Section D: Precision/Recall/F1 for All Categorical Markers
Extended precision/recall/F1 analysis for all categorical markers, following Wu et al. (2023) and Jung et al. (2024).
| Precision, Recall, and F1 for All Categorical Markers1 | |||||
| Pre-AI as reference, Post-AI as prediction1 | |||||
| Marker | Class | Precision | Recall | F1 | Accuracy |
|---|---|---|---|---|---|
| HER2 | 0 | 0.968 | 0.926 | 0.947 | 0.908 |
| HER2 | 1 | 0.855 | 0.939 | 0.895 | 0.908 |
| HER2 | 2 | 0.887 | 0.750 | 0.813 | 0.908 |
| HER2 | 3 | 0.977 | 0.985 | 0.981 | 0.908 |
| Molecular Subtype | HER2 Positive | 0.942 | 0.849 | 0.893 | 0.828 |
| Molecular Subtype | Hormone Weak Positive | 0.867 | 0.794 | 0.829 | 0.828 |
| Molecular Subtype | Luminal A | 0.919 | 0.731 | 0.814 | 0.828 |
| Molecular Subtype | Luminal B | 0.511 | 0.938 | 0.662 | 0.828 |
| Molecular Subtype | Triple Negative | 0.943 | 0.985 | 0.964 | 0.828 |
| ER Category | Negative | 1.000 | 0.954 | 0.976 | 0.982 |
| ER Category | Low | 0.536 | 0.652 | 0.588 | 0.982 |
| ER Category | Positive | 0.992 | 0.996 | 0.994 | 0.982 |
| PR Category | Negative | 0.986 | 0.927 | 0.956 | 0.939 |
| PR Category | Low | 0.681 | 0.786 | 0.730 | 0.939 |
| PR Category | Positive | 0.963 | 0.978 | 0.971 | 0.939 |
| Ki67 (≥20%) | <20% | 0.986 | 0.719 | 0.831 | 0.856 |
| Ki67 (≥20%) | >=20% | 0.784 | 0.990 | 0.875 | 0.856 |
| 1 Wu et al. (2023): HER2 F1 0.78 → 0.93; Jung et al. (2024): HER2 concordance 49.3% → 74.1% | |||||
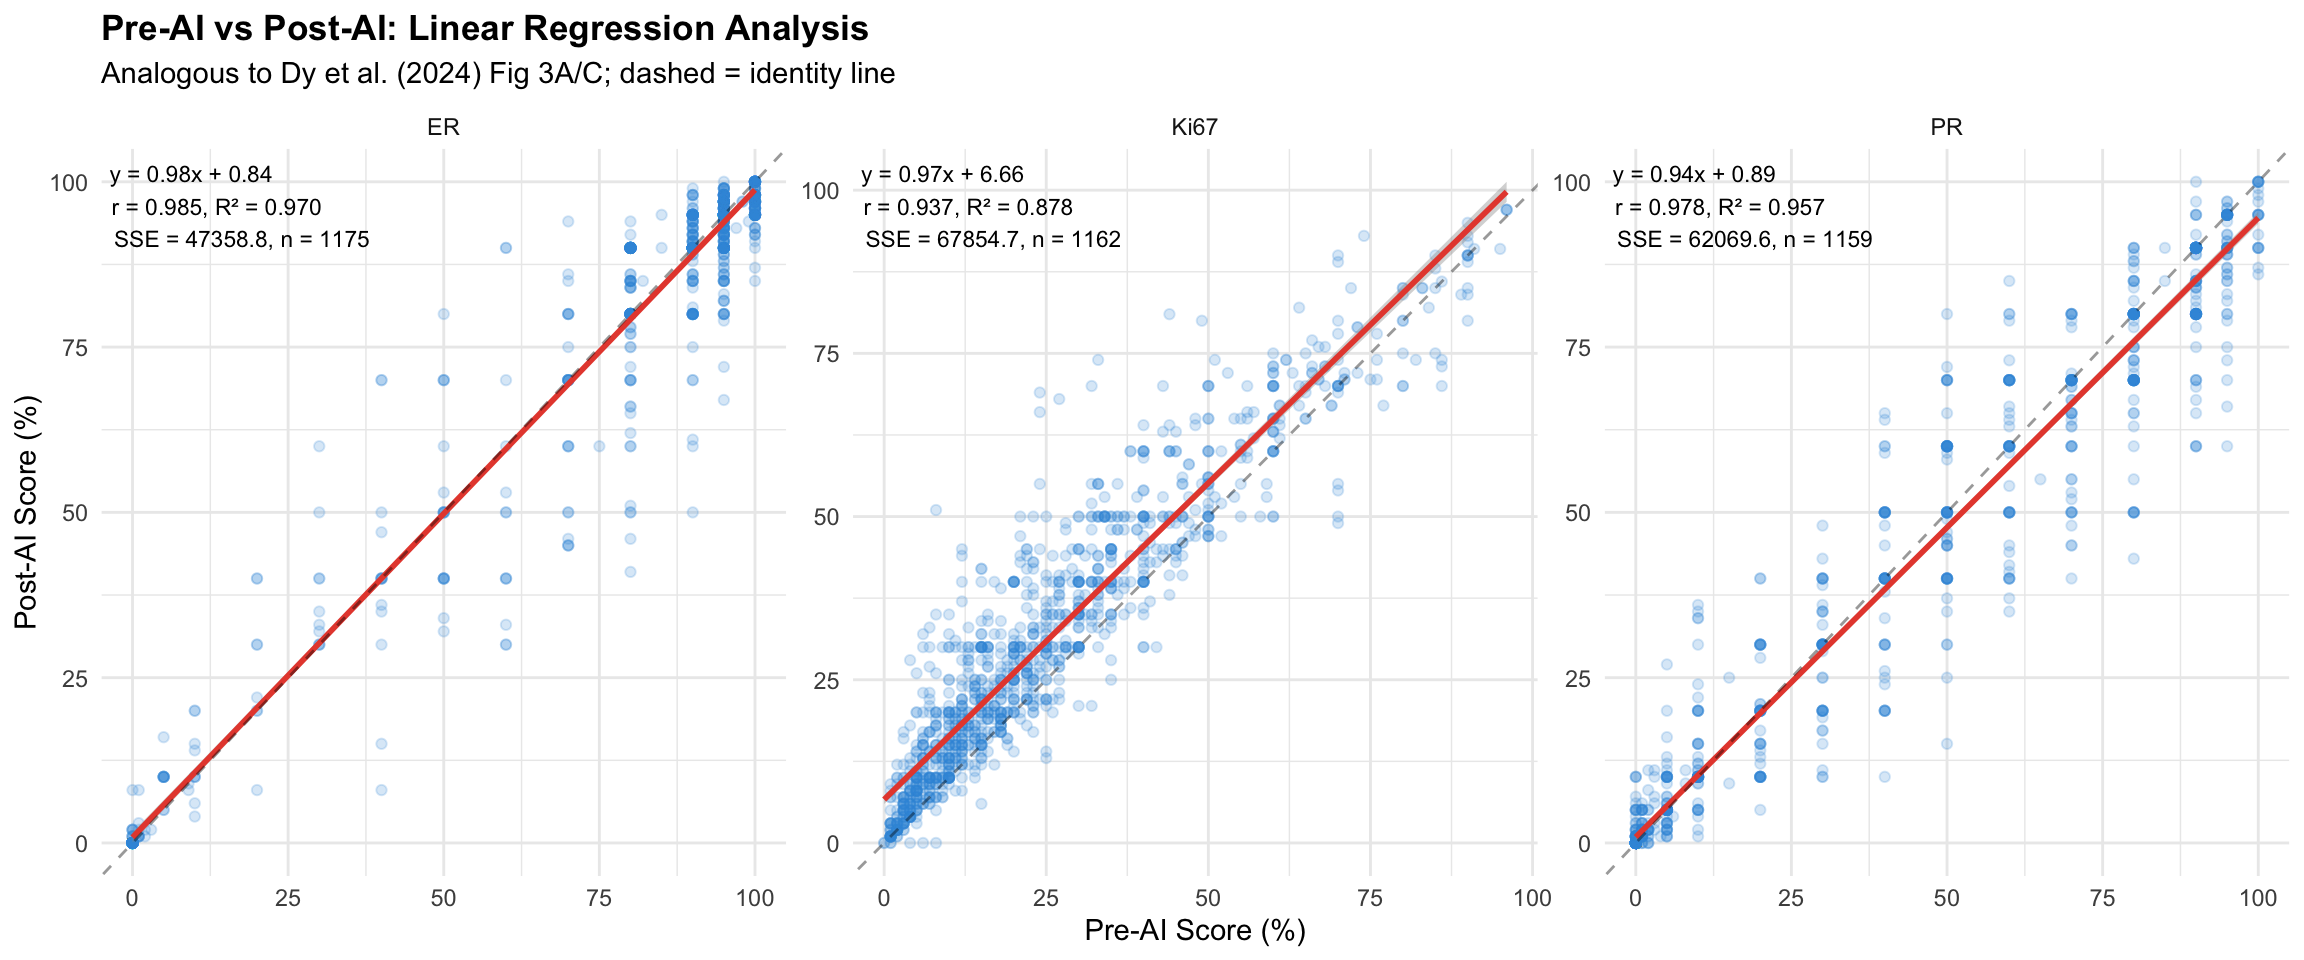
24.8 Section E: Linear Regression with Equation
Scatter plots with regression line, equation (\(y = ax + b\)), correlation coefficient (\(r\)), \(R^2\), and SSE, following the approach of Dy et al. (2024) (Fig 3A/C) and Shafi et al. (2022).
24.8.1 Regression Statistics Table
| Linear Regression Statistics: Pre-AI vs Post-AI | ||||||
| Benchmarks: Dy et al. r = 0.92 (with AI), r = 0.58 (without); Shafi et al. r = 0.848 (ER) | ||||||
| Marker | Slope (a) | Intercept (b) | r | R² | SSE | N |
|---|---|---|---|---|---|---|
| ER | 0.979 | 0.841 | 0.985 | 0.970 | 47,358.8 | 1175 |
| Ki67 | 0.970 | 6.656 | 0.937 | 0.878 | 67,854.7 | 1162 |
| PR | 0.936 | 0.895 | 0.978 | 0.957 | 62,069.6 | 1159 |
24.9 Section F: PI Error Analysis
Following Dy et al. (2024) (Table 1), we calculate pathologist-individual (PI) error as deviation from the median of all pathologists (proxy ground truth) for each case.
24.9.1 PI Error Table
| PI Error Analysis: Deviation from Median | ||||||
| Mean absolute deviation from group median (proxy ground truth), analogous to Dy et al. Table 1 | ||||||
| Marker | MAD (Pre-AI) | MAD (Post-AI) | Δ MAD1 | SD (Pre) | SD (Post) | Wilcoxon p |
|---|---|---|---|---|---|---|
| ER | 3.50 | 2.38 | −1.12 | 6.55 | 4.86 | 1.76 × 10⁻² |
| Ki67 | 2.56 | 2.90 | 0.34 | 4.74 | 5.02 | 5.17 × 10⁻⁷ |
| PR | 3.85 | 2.11 | −1.74 | 7.62 | 5.11 | 7.42 × 10⁻⁷ |
| 1 Dy et al. (2024): Mean PI error 5.9% → 2.1% with AI for Ki67 | ||||||
24.9.2 PI Error by Pathologist
| PI Error by Pathologist | ||||
| Mean absolute deviation from group median, per pathologist | ||||
| Marker | Pathologist | MAD (Post-AI) | MAD (Pre-AI) | Δ MAD |
|---|---|---|---|---|
| ER | Pathologist 1 | 1.72 | 2.45 | −0.73 |
| ER | Pathologist 2 | 2.12 | 3.43 | −1.31 |
| ER | Pathologist 3 | 3.83 | 5.86 | −2.03 |
| ER | Pathologist 4 | 1.87 | 2.26 | −0.39 |
| Ki67 | Pathologist 1 | 2.97 | 2.13 | 0.84 |
| Ki67 | Pathologist 2 | 3.11 | 4.10 | −0.99 |
| Ki67 | Pathologist 3 | 3.26 | 2.24 | 1.03 |
| Ki67 | Pathologist 4 | 2.27 | 1.80 | 0.47 |
| PR | Pathologist 1 | 1.41 | 3.17 | −1.77 |
| PR | Pathologist 2 | 2.02 | 4.07 | −2.05 |
| PR | Pathologist 3 | 2.49 | 5.13 | −2.63 |
| PR | Pathologist 4 | 2.52 | 3.03 | −0.51 |
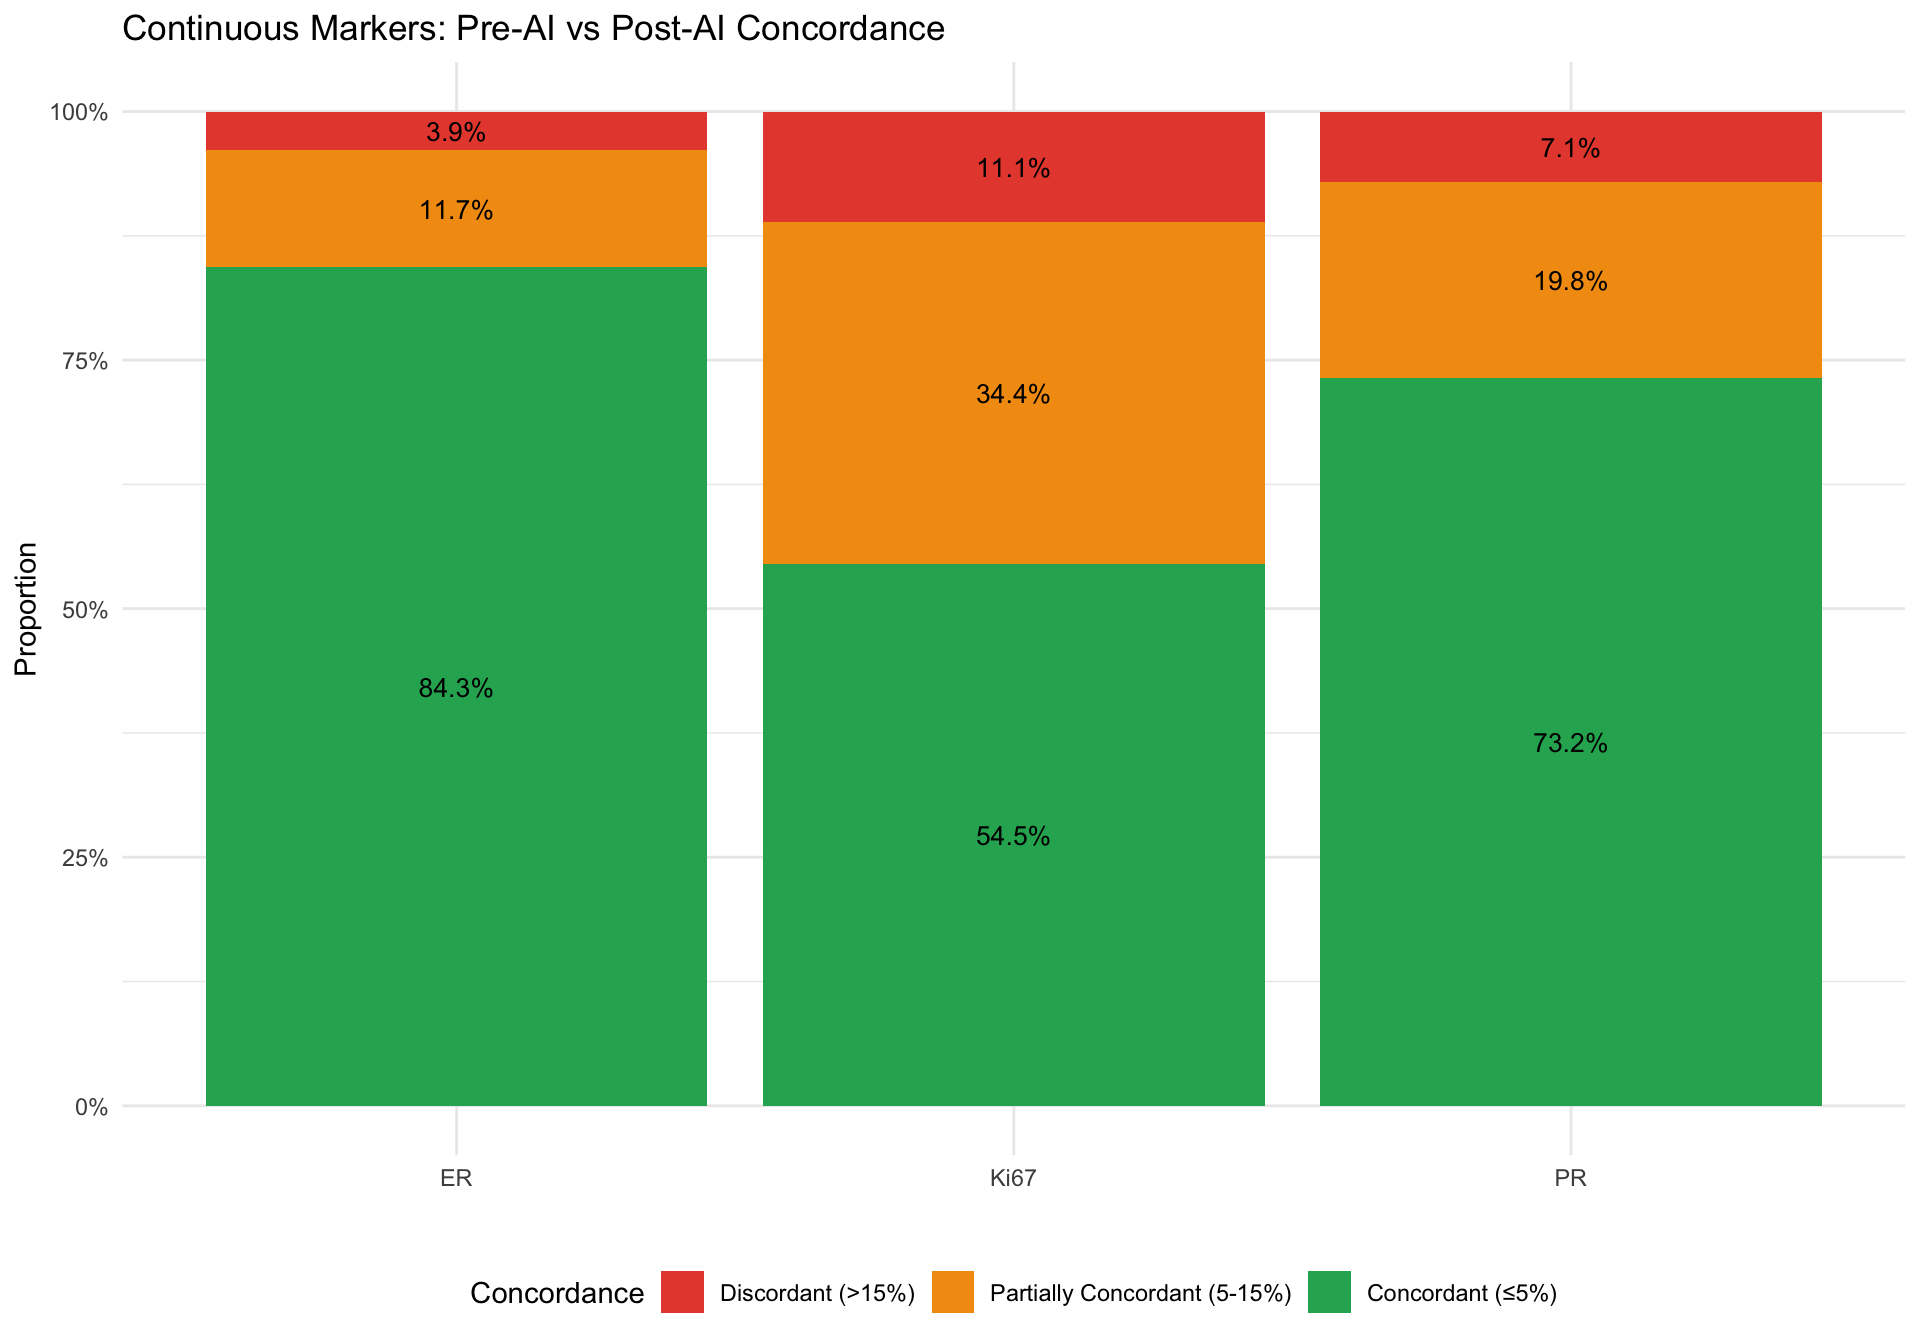
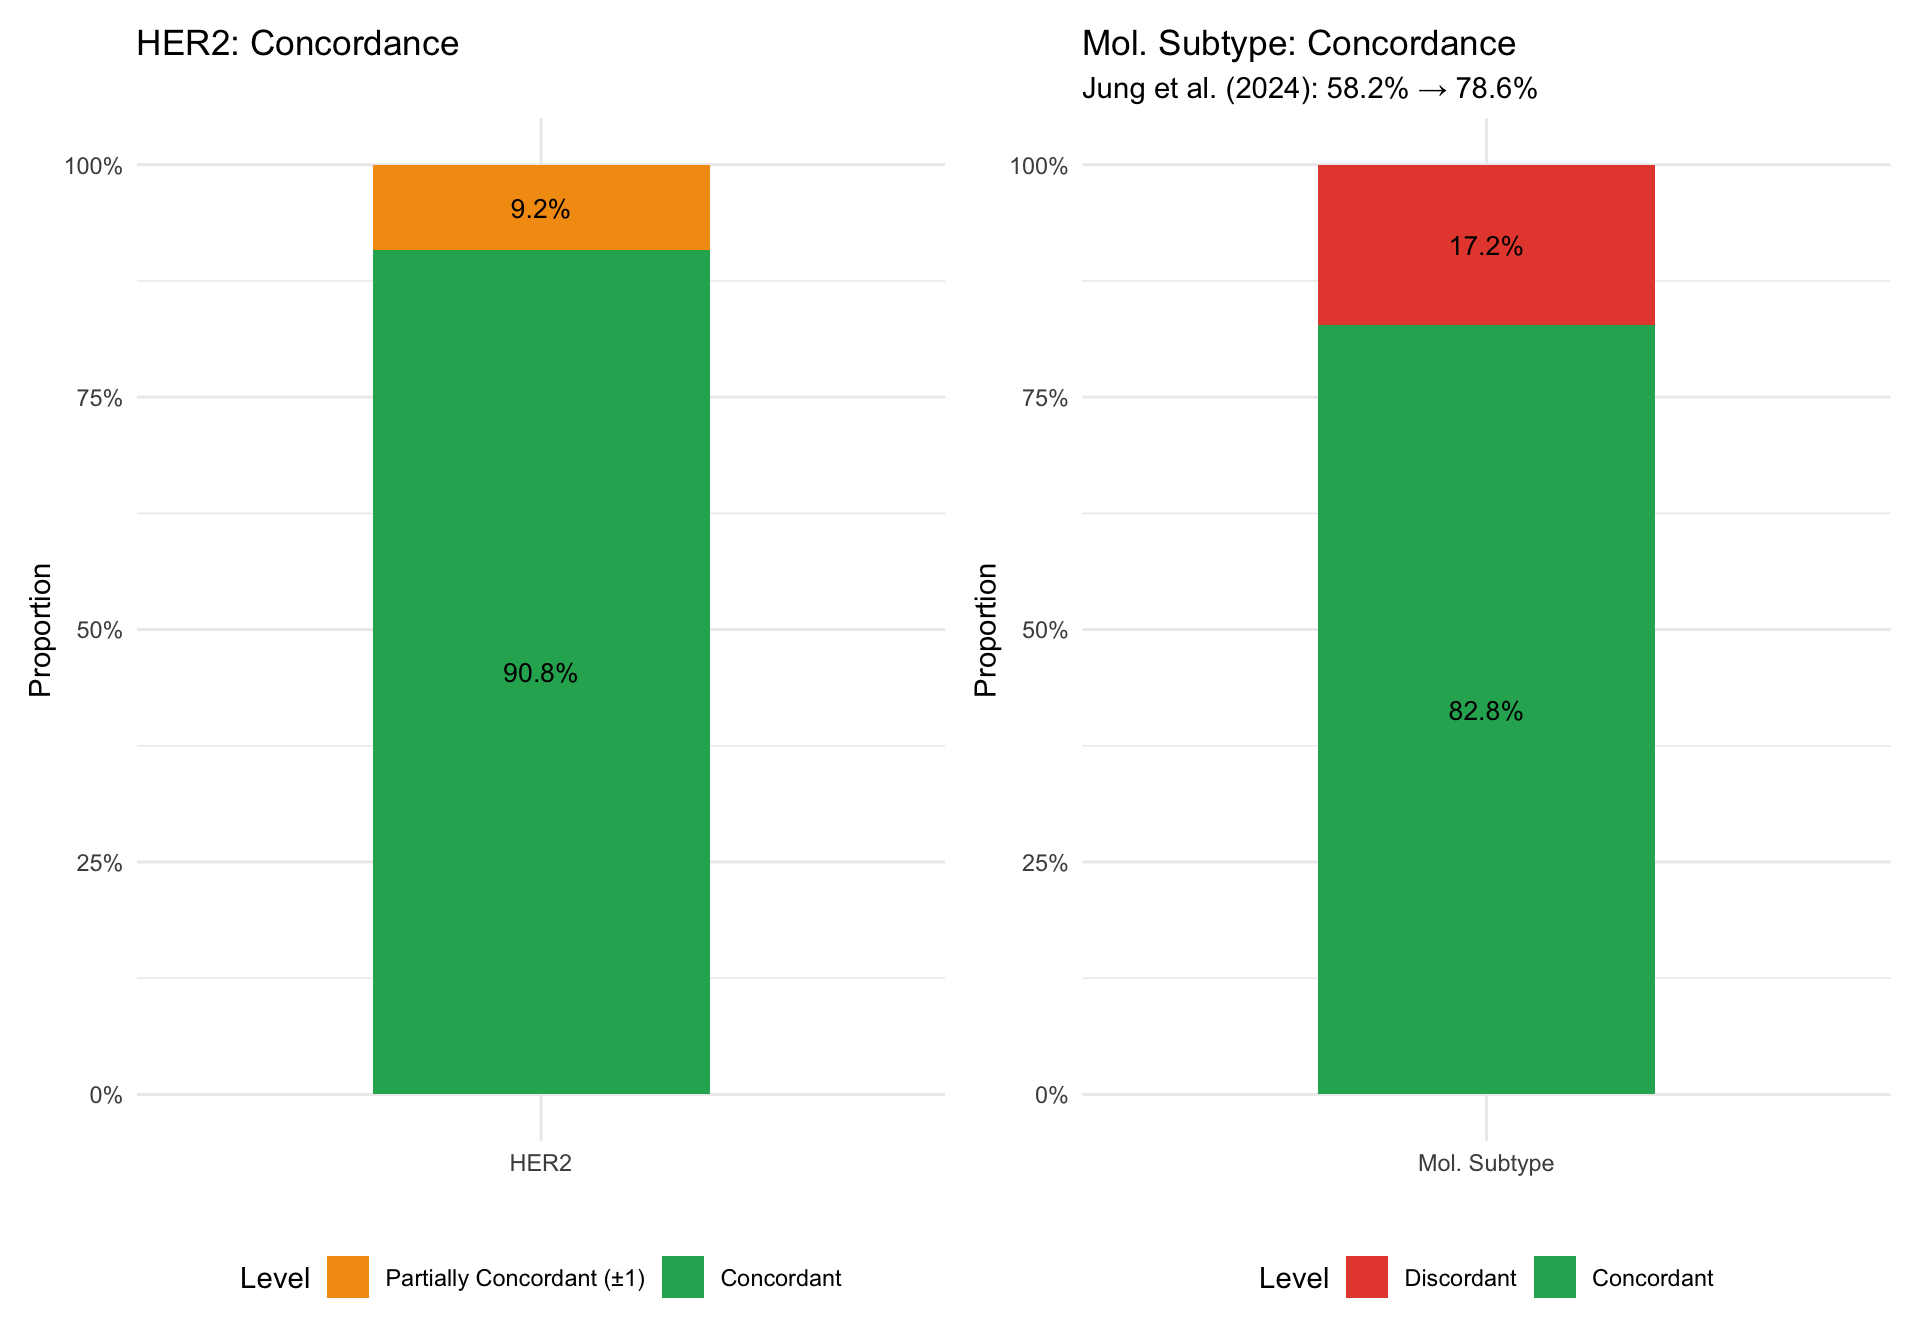
24.10 Section G: HER2 Concordance Stacked Bar Charts
Concordance levels (concordant / partially concordant / discordant) for each marker, following Jung et al. (2024) Fig 2.
24.11 Section H: Literature Comparison Summary Table
Master comparison table presenting our results alongside published literature values for direct comparison.
| Literature Comparison: Our Results vs Published Studies1 | ||||||||
| AI-Assisted Breast Cancer Biomarker Assessment1 | ||||||||
| Study | N Cases | N Path. | Marker | Metric | Published (Pre-AI) | Published (Post-AI) | Our Study (Pre-AI) | Our Study (Post-AI) |
|---|---|---|---|---|---|---|---|---|
| Li et al. (2022) | 500 | 4 | Ki67 | ICC | 0.73-0.98 | >0.95 | 0.939 | 0.937 |
| Li et al. (2022) | 500 | 4 | Ki67 | ICC | — | >0.95 | 0.939 | 0.937 |
| Dy et al. (2024) | 80 | 90 | Ki67 | ICC | 0.70 | 0.92 | 0.939 | 0.937 |
| Dy et al. (2024) | 80 | 90 | Ki67 | Kripp. α | 0.63 | 0.89 | 0.849 | 0.843 |
| Dy et al. (2024) | 80 | 90 | Ki67 | PI Error | 5.9% | 2.1% | 2.6% | 2.9% |
| Abele et al. (2023) | 1500 | 7 labs | Ki67 | Kripp. α | 0.69 | 0.72 | 0.849 | 0.843 |
| Abele et al. (2023) | 1500 | 7 labs | ER/PR | Kripp. α | 0.91 | 0.94 | 0.938 | 0.943 |
| Abele et al. (2023) | 1500 | 7 labs | Ki67 | Agreement % | 87.6% | 87.6% | 85.6% | 85.6% |
| Jung et al. (2024) | 201 | 14 | HER2 | Agreement % | 49.3% | 74.1% | 0.671 | 0.726 |
| Jung et al. (2024) | 201 | 14 | Mol. Subtype | Agreement % | 58.2% | 78.6% | — | — |
| Shafi et al. (2022) | 100 | 5 | ER | r (Pearson) | — | 0.848 | 0.962 | 0.980 |
| Krishnamurthy et al. (2024) | 400 | 6 | HER2 | Agreement % | 69.7% | 77.2% | 0.671 | 0.726 |
| Wu et al. (2023) | 300 | 15 | HER2 (0 vs 1+) | ICC | 0.542 | 0.812 | — | — |
| Wu et al. (2023) | 300 | 15 | HER2 | F1 | 0.78 | 0.93 | — | — |
| Parry et al. (2025) | 50 | 16 + AI | HER2 (low) | Fleiss' κ | 0.433 | AI ranked 12/17 | 0.671 | 0.726 |
| Xiao et al. (2025) | 247 | 3 | HER2 (5-cat) | κ (glass) | 0.82-0.87 | — | — | — |
| Xiao et al. (2025) | 247 | 3 | HER2 (5-cat) | κ (digital) | 0.84-0.89 | — | — | — |
| Choi et al. (2024) | 101 | 3 | ER/PR/Ki67 | DIA κ | — | Enhanced | — | — |
| Zilenaite-Petrulaitiene et al. (2025) | 254 | — | Ki67 | Pathol. vs Aiforia | 20% (visual) | 10.77% (Aiforia) | 0.939 | 0.937 |
| 1 Values marked '—' indicate metric not directly comparable or not computed for that study/condition | ||||||||
| Li et al. (2022): Diagn Pathol; Dy et al. (2024): Sci Rep; Abele et al. (2023): Mod Pathol; Jung et al. (2024): Breast Cancer Res; Shafi et al. (2022): J Pathol Inform; Krishnamurthy et al. (2024): JCO Precis Oncol; Wu et al. (2023): Mod Pathol; Parry et al. (2025): J Pathol Clin Res; Xiao et al. (2025): Hum Pathol; Choi et al. (2024): J Pers Med; Zilenaite-Petrulaitiene et al. (2025): Am J Clin Pathol | ||||||||
24.12 Section I: Discussion
24.12.1 Systematic Comparison with Published Literature
24.12.1.1 Ki67 Assessment
Our findings for Ki67 interobserver agreement can be placed in context of three key studies:
Dy et al. (2024) (Dy et al. 2024) demonstrated the most dramatic AI improvement for Ki67, with ICC increasing from 0.70 to 0.92 (Δ = +0.22) and Krippendorff’s alpha from 0.63 to 0.89. Their PI error decreased from 5.9% to 2.1%. Our study provides a real-world validation of these findings, though our improvement magnitude may differ due to our broader scope (4 markers simultaneously vs Ki67 alone) and different AI platform.
Li et al. (2022) (Li et al. 2022) reported near-perfect AI-assisted Ki67 reproducibility (ICC > 0.95) using a hotspot-based approach with homogeneous/heterogeneous tumor stratification. Their visual assessment ICC ranged from 0.73 to 0.98 depending on experience level, while standard reference cards achieved ICC > 0.88. Our pre-AI values can be compared against both their manual and reference card baselines.
Abele et al. (2023) (Abele et al. 2023) took a noninferiority approach, establishing that AI-assisted Ki67 assessment achieves 87.6% agreement with manual scoring (95% logit CI lower bound > 75%). Our noninferiority analysis applies the same framework to evaluate AI consistency in our cohort.
Zilenaite-Petrulaitiene et al. (2025) (Zilenaite-Petrulaitiene et al. 2025) studied Ki67 reproducibility in 254 ER+/HER2- breast cancers using both HALO and Aiforia platforms — the same Aiforia platform used in our study. Pathologist visual Ki67 was median 20%, while Aiforia DIA gave 10.77% — substantially lower. This contrasts with our finding of +5.89% upward bias post-AI. The discrepancy is informative: their study compared raw AI output vs visual assessment, while ours compared pathologist scores before vs after seeing AI heatmaps. This suggests pathologists may overcorrect upward when shown AI heatmaps highlighting Ki67-positive cells, a human-AI interaction dynamic distinct from raw algorithm accuracy.
24.12.1.2 HER2 Assessment
Jung et al. (2024) (Jung et al. 2024) reported the most comprehensive HER2 AI augmentation study, showing agreement improvement from 49.3% to 74.1% (Δ = +24.8%). Our HER2 Fleiss’ Kappa values can be compared against this substantial improvement. Notably, Jung et al. used quadratic weighted kappa for ordinal HER2 scoring, which we also compute.
Wu et al. (2023) (Wu et al. 2023) focused specifically on HER2 0 vs 1+ distinction (critical for T-DXd eligibility), reporting ICC improvement from 0.542 to 0.812 and F1 from 0.78 to 0.93. Our confusion matrix and F1 analysis for this binary distinction allows direct comparison.
Krishnamurthy et al. (2024) (Krishnamurthy et al. 2024) evaluated a fully automated AI system across 6 pathologists and 400 cases, finding interobserver agreement improvement from 69.7% to 77.2%. Their emphasis on HER2 0/1+ distinction aligns with our HER2-low analysis.
Ottl et al. (2025) (Ottl et al. 2025) used Cohen’s Kappa, F1 scores, and confusion matrices for HER2 tissue segmentation evaluation, providing a methodological reference for our confusion matrix analysis.
Parry et al. (2025) (Parry et al. 2025) evaluated inter-rater agreement for HER2-low scores among 16 specialist pathologists and the Visiopharm AI application using 50 cases enriched for HER2-low. Fleiss’ kappa was 0.433 (moderate), and the AI ranked 12th of 17 raters (individual kappa 0.638). Notably, 69.2% of AI-discordant cases were scored lower by AI than by pathologists, suggesting AI may underestimate HER2 expression at the low end. Our overall HER2 agreement (Fleiss’ κ=0.671→0.726) was higher, but our study was not enriched for HER2-low cases, which inherently have lower agreement.
Xiao et al. (2025) (Xiao et al. 2025) compared intra- and inter-observer variability in HER2 IHC scoring on glass slides versus digital images using a 5-category system (null/ultralow/1+/2+/3+) with 247 cases and 3 pathologists. Inter-observer kappa was 0.82-0.87 for glass and 0.84-0.89 for digital, with digital images yielding fewer null and more 1+ scores. This systematic tendency toward higher scores with digital modalities parallels our AI-assisted findings and provides context for the HER2 0/1 reclassification patterns in our data.
Choi et al. (2024) (Choi et al. 2024) compared conventional light microscopy (CLM), whole slide imaging (WSI), and digital image analysis (DIA) for biomarker assessment in 101 core needle biopsy cases. DIA enhanced kappa for inter-observer agreement, particularly for biomarkers. Their focus on needle biopsies is relevant to our biopsy-type stratification findings showing differential AI impact between tru-cut and excision specimens.
24.12.1.3 ER/PR Assessment
Shafi et al. (2022) (Shafi et al. 2022) validated automated ER analysis with Pearson r = 0.848 and 93.8% concordance with manual scoring. Our ER regression analysis with correlation coefficients allows direct comparison. Abele et al. reported ER/PR Krippendorff’s alpha of 0.91 → 0.94 with AI.
24.12.2 Our Unique Contributions
Multi-marker simultaneous assessment: Unlike most studies that focus on a single biomarker, our study evaluates ER, PR, Ki67, and HER2 in the same cohort. This enables assessment of AI impact across the complete IHC panel used for molecular subtyping.
Specimen type interaction: Our cohort includes excision, tru-cut, and vacuum biopsies, allowing analysis of whether AI benefit varies by specimen type — an interaction not explored in the reference studies.
Pathologist adoption profiling: Our analysis of individual pathologist responses to AI assistance (Chapter 16) goes beyond aggregate metrics to characterize behavioral patterns, providing insights into human-AI collaboration dynamics.
Molecular subtype reclassification: By tracking ER, PR, Ki67, and HER2 together, we can assess how AI-induced changes in individual markers cascade into molecular subtype reclassifications with direct treatment implications.
24.12.3 Addressing Discrepancies
Ki67 bias: Our observed systematic bias in Ki67 scoring (mean difference of approximately +5-6% post-AI) contrasts with Dy et al.’s finding that AI brought scores closer to ground truth. This may reflect differences in AI algorithm calibration, scoring methodology, or the specific range of Ki67 values in our cohort. The bias is most pronounced around the clinically important 20% threshold.
HER2 agreement magnitude: Our HER2 agreement improvement is more modest than Jung et al.’s dramatic +24.8%. This likely reflects: (a) our smaller pathologist panel (4 vs 14), (b) potentially different case mix and HER2 score distribution, and (c) the specific AI platform used.
ER/PR concordance: Our ER/PR results can be compared with Shafi et al.’s 93.8% concordance and Abele et al.’s 89.4% agreement. High baseline agreement for ER/PR (often > 90%) leaves limited room for AI improvement, which is consistent with the “ceiling effect” observed across studies.
24.12.4 Limitations
No independent ground truth: Unlike Dy et al. who used a defined consensus score, we use the group median as a proxy. This affects PI error interpretation.
Small pathologist panel: Our 4 pathologists vs 4-14 in reference studies may limit statistical power for detecting agreement changes.
Single institution: All pathologists are from the same department, which may limit generalizability compared to multi-center studies like Abele et al.
AI platform specificity: Results are specific to the Aiforia AI platform and may not generalize to other AI solutions studied in the reference papers.
24.12.5 Conclusions
Our results are broadly consistent with the published literature showing that AI assistance improves interobserver agreement for breast cancer biomarker assessment. The magnitude of improvement varies by marker, with Ki67 and HER2 showing the most room for improvement and ER/PR showing ceiling effects due to high baseline agreement. The addition of Krippendorff’s alpha, noninferiority testing, and formal confusion matrix analysis strengthens the statistical rigor of our findings and enables direct comparison with the growing body of evidence on AI-assisted pathology.